
The operations delivered improved safety performances as the group lost-time injury frequency rate (LTIFR) per 200 000 man-hours improved to 0.31 (F2021: 0.41). The total recordable injury frequency rate (TRIFR)* improved to 0.69 from 0.81.
* TRIFR includes the number of fatal injuries, number of lost-time injuries and number of medical cases.
Regrettably, two colleagues were fatally injured in separate accidents in the review period. At Two Rivers Mine, an employee was fatally injured in a fall-of-ground accident at North Decline on 1 September 2021.
At Modikwa Platinum Mine, two contractor employees were struck by a run-away load-haul-dump (LHD) tyre that was being fitted. One employee was fatally injured, while the other was treated in hospital and has fully recovered from her injuries.
We extend our sincere condolences to the families, friends and colleagues of the employees who lost their lives at our operations. We continue to work towards ensuring zero harm at all operations.
Black Rock Mine achieved 10 million fatality-free shifts and Beeshoek Mine achieved 5 million fatality-free shifts, which took 13 and 18 years respectively to achieve.
In F2021, ARM set the long-term target of achieving net-zero greenhouse gas (GHG) emissions (scope 1 and 2) from mining by 2050. Building on this, in F2022 we focused on developing decarbonisation pathways that detail the short and medium-term steps needed to achieve this long-term target. We are working to identify appropriate and just transition options for each operation that are sustainable and financially responsible in this regard.
ARM Platinum has signed an agreement subject to certain conditions precedent to purchase solar power from Sola Group. As part of the power-purchase agreement (PPA), Sola Group will build a solar photovoltaic (PV) facility and wheel the electricity generated by that facility to ARM Platinum's operations in Limpopo and Mpumalanga provinces. The project will deliver clean, low-cost energy while enabling these operations to reduce daytime loadshedding.
Despite lower commodity prices for our key commodities, including iron ore and platinum group metals (PGMs), we improved our net cash from R8 202 million at 30 June 2021 to R11 175 million at 30 June 2022. This robust financial position gives ARM the flexibility to opportunistically pursue value-enhancing growth prospects.
In F2022, total value created was R27.5 billion (F2021: R30.6 billion) on a segmental basis which was distributed to stakeholders and reinvested in our business as shown below.
| R million | F2022 | F2021 |
| Salaries and fringe benefits to employees | 4 214 | 3 895 |
|---|---|---|
| Taxes to government | 6 545 | 8 895 |
| Income tax | 4 817 | 6 506 |
| Royalty tax | 1 728 | 2 389 |
| Finance costs, dividends and non-controlling interest to capital providers | 8 532 | 6 534 |
| Dividends | 6 270 | 3 322 |
| Non-controlling interest | 1 938 | 2 846 |
| Finance costs | 324 | 366 |
| Total value distributed | 19 291 | 19 324 |
| Reinvested in the group | 8 198 | 11 239 |
| Amortisation | 2 042 | 1 935 |
| Reserves retained | 6 156 | 9 304 |
| Total value | 27 489 | 30 563 |
We are pleased that ARM Mining Consortium declared a dividend of R255 million (F2021: R71 million) to communities that have an effective 8.5% shareholding in Modikwa Mine. These dividends will be invested in projects that will benefit the communities neighbouring Modikwa Mine.
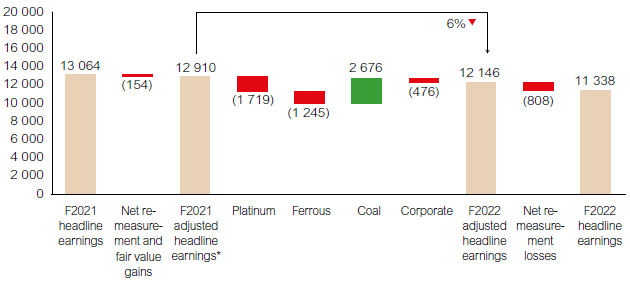
Headline earnings for the year ended 30 June 2022 decreased by 13% to R11 338 million (or R57.87 per share) compared to the corresponding period headline earnings of R13 064 million (or R66.88 per share). The F2022 headline earnings include re-measurement losses of R808 million.
Adjusted headline earnings, excluding these re-measurements gains and losses, were down only 6% at R12 146 million (F2021: R12 910 million).
Headline earnings variance analysis
| * | Adjusted headline earnings exclude re-measurement and fair value gains and losses as summarised on the table on slide 45 of the F2022 results presentation. The adjusted headline earnings are included for illustrative purposes and are the responsibility of the board of directors. They should be considered in addition to, and not as a substitute for, or superior to, measures of financial performance, financial position or cash flows reported in line with IFRS. |
The average realised rand strengthened by 1% versus the US dollar to R15.21/US$ in F2022 compared to R15.39/US$ in F2021. For reporting purposes, the closing exchange rate at 30 June 2022 was R16.38/US$ (30 June 2021: R14.27/US$).
ARM Ferrous headline earnings were 16% lower at R6 682 million (F2021: R7 927 million), driven by a R2 868 million decrease in headline earnings in the iron ore division which was partially offset by a R1 620 million increase in the headline earnings in the manganese division.
The iron ore division was negatively impacted by lower average realised US dollar prices, lower sales volumes, higher freight rates and the stronger rand versus US dollar exchange rate. In addition, iron ore headline earnings included a R618 million (pre-tax) negative fair value adjustment on iron ore sales (F2021: R881 million positive adjustment), of which 45% is based on confirmed prices and 55% is based on forward prices.
Higher headline earnings in the manganese division were driven by an increase in the average realised US dollar manganese ore and manganese alloy prices, partially offset by higher freight rates and the stronger rand versus US dollar exchange rate.
ARM Platinum headline earnings decreased by 34% to R3 066 million (F2021: R4 666 million).
Modikwa Mine reported a 17% decline in headline earnings to R1 270 million (F2021: R1 529 million), which included negative mark-to-market adjustments of R231 million (F2021: R299 million positive mark-to-market adjustments). The mine increased production volumes by 17% and achieved a below-inflation increase in production unit costs (on a rand per 6E PGM ounce basis) of 2%.
Two Rivers Mine headline earnings reduced to R1 968 million (F2021: R2 972 million), mainly due to negative mark-to-market adjustments of R709 million (F2021: R795 million positive mark-to-market adjustments) and a 12% increase in production unit costs (on a rand per 6E PGM ounce basis). Challenges with grade persisted at the mine as the head grade reduced to 3.20g/t compared to 3.43g/t last year.
For more detail and a table showing the mark-to-market adjustments at Modikwa and Two Rivers mines, refer below.
Nkomati Mine reported a headline loss of R172 million (F2021: R165 million headline earnings). The mine was placed on care and maintenance on 15 March 2021. ARM and its joint-venture partner are considering various options for the future of Nkomati Mine.
ARM Coal reported headline earnings of R928 million (F2021 headline loss: R250 million). These included a re-measurement loss of R1 256 million (F2021 re-measurement gain: R242 million) which came about as a result of accelerated repayment of the loans owing to Glencore.
Adjusted headline earnings for the ARM Coal division were R2 676 million higher at R2 184 million (F2021: R8 million adjusted headline loss) driven by increased export thermal coal prices, which were partially offset by lower sales volumes due mainly to Transnet Freight Rail (TFR) logistics challenges.
Given the significant acceleration in loan repayment of the ARM Coal loans to Glencore, a R766 million re-measurement loss is included in the GGV headline earnings. GGV Mine adjusted headline earnings, which exclude these re-measurement losses, were R761 million (F2021: R196 million adjusted headline loss). Refer below for a detailed analysis of the GGV and PCB operational profit performance. Re-measurement losses of R490 million are included in PCB headline earnings. PCB adjusted headline earnings were R1 423 million (F2021: R296 million adjusted headline loss).
ARM Corporate and other (including Gold) reported headline earnings of R826 million (F2021: R828 million). Headline earnings include higher re-measurement gains of R448 million (F2021: R31 million), which were partially offset by reduced management fees received of R1 489 million (F2021: R1 800 million).
Machadodorp Works reported a headline loss of R164 million (F2021: R107 million) as research into developing energy-efficient smelting technologies progressed.
| R million | Reviewed F2022 |
Audited F2021 |
% change |
| ARM Ferrous |
6 682 | 7 927 | (16) |
|---|---|---|---|
| Iron ore division | 4 654 | 7 522 | (38) |
| Manganese division | 2 068 | 448 | >200 |
| Consolidation adjustment | (40) | (43) | 7 |
| ARM Platinum | 3 066 | 4 666 | (34) |
| Two Rivers Mine | 1 968 | 2 972 | (34) |
| Modikwa Mine | 1 270 | 1 529 | (17) |
| Nkomati Mine | (172) | 165 | (204) |
| ARM Coal* | 928 | (250) | |
| Goedgevonden Mine* | (5) | 10 | (150) |
| PCB operations* | 933 | (260) | |
| ARM Corporate and other | 662 | 721 | (8) |
| Corporate and other (including Gold) | 826 | 828 | – |
| Machadodorp Works | (164) | (107) | (53) |
| Headline earnings | 11 338 | 13 064 | (13) |
| * | Given the significant acceleration loan repayment of the ARM Coal loans to Glencore, a R766 million re-measurement loss is included in the GGV headline earnings. GGV Mine adjusted headline earnings, which exclude these re-measurement losses, were R761 million (F2021: R196 million adjusted headline loss). Re-measurement losses of R490 million are included in PCB headline earnings. PCB adjusted headline earnings were R1 423 million (F2021: R296 million adjusted headline loss). PCB refers to Participative Coal Business. |
Basic earnings of R12 426 million (F2021: R12 626 million) included an attributable impairment of property, plant and equipment at Khumani Mine of R20 million (before tax of R6 million), and impairment reversals as follows:
Refer to note 8 of the financial statements for further details.
At 30 June 2022, ARM's net cash was R11 175 million (30 June 2021: R8 202 million). This amount excludes attributable cash and cash equivalents held at ARM Ferrous (50% of Assmang) of R5 342 million (30 June 2021: R4 099 million). There was no debt at ARM Ferrous in either of these reporting periods.
| R million | F2022 | F2021 | % change |
| Assmang | 5 500 | 4 000 | 38 |
|---|---|---|---|
| Modikwa Mine | 1 000 | 290 | >200 |
| Two Rivers Mine | 1 245 | 1 431 | (13) |
| Harmony Gold | 50 | 82 | (39) |
| Total dividends received | 7 795 | 5 803 | 34 |
Cash generated from operations increased by R706 million to R8 508 million (F2021: R7 802 million) after an outflow in working capital of R1 640 million (F2021: R5 305 million outflow), mainly due to an outflow in trade receivables and trade payables.
In F2022, ARM paid R6 270 million in dividends to its shareholders, representing the final dividend of R20.00 per share declared for F2021 and the 1H F2022 interim dividend of R12.00 per share (F2021: R3 322 million was paid representing the F2020 final dividend of R7.00 per share and the 1H F2021 interim dividend of R10.00 per share).
Borrowings of R109 million (F2021: R648 million) were repaid during the period, resulting in gross debt of R484 million at 30 June 2022 (30 June 2021: R1 469 million).
The group net asset value per share increased by 15% to R205.45 per share (30 June 2021: R179.08 per share).
We continued to evaluate opportunities to grow our company, deliver competitive returns to shareholders and create sustainable value for all stakeholders.
We are pleased to have concluded the acquisition of the Bokoni Platinum Mine from Anglo American Platinum and Atlatsa Resources Corporation.
Bokoni Mine was placed on care and maintenance in October 2017 amid adverse market conditions. A new mine plan is being developed which will focus predominantly on mining the UG2 resource and will aim to employ mechanised mining methods where practical and sustainable in new mining areas and target predominantly on-reef development. This plan targets better ground conditions and higher-grade mining areas, while fully leveraging existing mining and processing infrastructure. We are concurrently evaluating early mining opportunities to capitalise on the current strong PGM basket prices. The new mine plan is expected to improve efficiencies, reduce unit costs and provide early revenue.
The focus for the next 12 months will be to finalise a definitive feasibility study, which will be completed in 2H F2023. This will enable ARM to begin mining operations in 2023. ARM envisages development capital of approximately R5.3 billion (in real 2021 terms) to be spent over three years to ramp up the mine to a steady-state production of approximately 300 000 6E PGM ounces and 255 000 tonnes of chromite concentrate per annum. Steady state is expected to be achieved from 2028.
Segmental capital expenditure for F2022 was R4 727 million (F2021: R4 105 million). This included attributable capitalised waste stripping at the iron ore operations of R650 million (F2021: R426 million). Capital expenditure for the divisions is shown below and discussed in each division's operational performance section of this report.
| R million | F2022 | F2021 |
| ARM Ferrous | 2 450 | 2 221 |
|---|---|---|
| Iron ore division | 1 445 | 1 198 |
| Manganese division | 1 110 | 1 124 |
| Consolidation adjustment | (105) | (101) |
| ARM Platinum | 2 159 | 1 611 |
| Two Rivers Mine | 1 806 | 1 281 |
| Modikwa Mine | 353 | 330 |
| Nkomati Mine | – | – |
| ARM Coal (Goedgevonden Mine) | 110 | 263 |
| ARM Corporate | 8 | 10 |
| Total | 4 727 | 4 105 |
Provisional results for the year ended 30 June 2022 have been prepared in accordance with IFRS and disclosures are in line with IAS 34 Interim financial reporting.
These results have been achieved in conjunction with ARM's partners at the various operations: Anglo American Platinum Limited, Assore South Africa Proprietary Limited, Impala Platinum Holdings Limited, Norilsk Nickel Africa Proprietary Limited and Glencore Operations South Africa (Pty) Ltd.
Rounding may result in minor computational discrepancies in tables.
Iron ore prices were subdued as Chinese crude steel production remained under pressure for much of calendar year 2022. Early 2022 saw output cuts in some regions during the winter Olympics, while Covid-19 lockdowns in China negatively impacted both steel demand and supply in later months.
Average realised US dollar export iron ore prices were 22% lower on a free-on-board (FOB) equivalent basis at US$121 per tonne (F2021: US$156 per tonne) as the 62% iron ore fines index dropped from peak levels above US$230 per tonne at the beginning of July 2021.
Total iron ore sales volumes decreased by 2% to 16.1 million tonnes (F2021: 16.4 million tonnes). Export sales volumes were 1% lower at 13.2 million tonnes (F2021: 13.3 million tonnes) due to logistical challenges as Transnet Freight Rail (TFR) was impacted by derailments, excessive rain and other operational and maintenance challenges. Assmang and other iron ore exporters in South Africa continue to engage regularly with Transnet to address these challenges, seeking improvement for both rail and port operations.
The export sales lump/fines ratio increased from 58:42 in F2021 to 60:40 in F2022.
Local sales volumes decreased by 8% to 2.9 million tonnes (F2021: 3.1 million tonnes) due to lower offtake from Beeshoek Mine's sole customer.
Total iron ore production volumes increased by 2% to 16.2 million tonnes (F2021: 15.9 million tonnes), with 13.0 million tonnes at Khumani Mine (F2021: 12.6 million tonnes) and 3.1 million tonnes at Beeshoek Mine (F2021: 3.3 million tonnes).
Water supply to the Northern Cape mines remains a risk. The mines, through the Northern Cape Mines Leadership Forum (MLF) and in collaboration with the Mineral Council of South Africa (MCSA), are continuously engaging with the Department of Water and Sanitation and its officials to address this risk. Mines are contributing to the maintenance and repairs of the Vaal Gamagara Pipeline and the Assmang operations are also putting measures in place to supplement water supply from neighbouring mines' excess water. At this early stage, these measures have had a positive effect on water supply to the mines, but the long-term solution will be the refurbishment of the Vaal Gamagara Pipeline, which is being addressed as a key priority between the department and the mines.
On-mine production unit costs for the iron ore division increased by 12% to R317 per tonne (F2021: R283 per tonne) mainly due to inflation-related cost escalations, lower production volumes at Beeshoek Mine, together with above-inflation increases in the costs of diesel, explosives, consumables and maintenance. The cost of diesel and explosives, which comprised approximately 20% of total costs, were 57% and 42% higher, respectively.
On-mine unit cash costs for the iron ore division increased by 10% to R375 per tonne (F2021: R340 per tonne). On-mine production unit costs at Khumani Mine increased by 10% to R319 per tonne (F2021: R289 per tonne) while on-mine unit cash costs (which exclude run-of-mine ore stock movements, and include capitalised wastestripping costs and certain non-cash adjustments) were R361 per tonne (F2021: R329 per tonne).
On-mine production unit costs at Beeshoek Mine increased by 19% while unit cash costs increased by 13%.
Unit costs of sales for the iron ore division, which include marketing and distribution costs, were 8% higher mainly due to the increase in on-mine production costs (as discussed above) and a 60% average increase in freight rates. Sales and marketing costs, which are determined based on free-on-board revenue, were lower owing to the decline in US dollar iron ore prices in F2022.
Capital expenditure for the iron ore division was R2 890 million on a 100% basis (F2021: R2 397 million), including capitalised waste-stripping costs of R1 318 million (F2021: R851 million). Capitalised waste-stripping costs were higher at both Khumani and Beeshoek mines due to increased capital mining areas and higher mining costs.
| unit | F2022 | F2021 | % change | |
| Prices | ||||
| Average realised export price* | US$/t | 121 | 156 | (22) |
| Volumes | ||||
| Export sales | 000t | 13 176 | 13 269 | (1) |
| Local sales | 000t | 2 888 | 3 148 | (8) |
| Total sales | 000t | 16 064 | 16 417 | (2) |
| Production | 000t | 16 201 | 15 928 | 2 |
| Export sales lump/fines split | % | 60:40 | 58:42 | |
| Export sales CIF/FOB** split | % | 56:44 | 55:45 | |
| Unit costs | ||||
| Change in on-mine production unit costs | % | 12 | 13 | |
| Change in unit cash costs | % | 10 | ||
| Change in unit cost of sales | % | 8 | 16 | |
| Capital expenditure | R million | 2 890 | 2 397 | 21 |
| * | Average realised export iron ore prices on an FOB equivalent basis. |
| ** | CIF – cost, insurance and freight; FOB – free-on-board. |
| R million | F2022 | F2021 | % change |
| Sales | 6 005 | 5 118 | 17 |
|---|---|---|---|
| Operating profit | 1 363 | 601 | 127 |
| Contribution to headline earnings | 1 051 | 412 | 155 |
| Capital expenditure | 1 067 | 1 030 | 4 |
| Depreciation | 450 | 358 | 26 |
| EBITDA | 1 813 | 959 | 89 |
Average realised US dollar prices for export manganese ore increased by 30% as the average index price for 44% manganese ore was US$6.18/dmtu (CIF) for F2022 (F2021: US$4.63/dmtu (CIF)). The average index price for 37% manganese ore was US$4.82/dmtu (CIF) in F2022 (F2021: US$4.30/dmtu (CIF)).
Total manganese ore sales volumes in F2022 were flat at 3.96 million tonnes. Export sales volumes were marginally lower at 3.7 million tonnes (F2021: 3.8 million tonnes) and local sales volumes were higher at 0.29 million tonnes (F2021: 0.14 million tonnes).
Export manganese ore volumes of 3.7 million tonnes were achieved for F2022 through Gqeberha Bulk Ore Terminal (BOT) and Saldanha Multi-Purpose Terminal (MPT). Delivery by TFR and Transnet Port Terminals (TPT) was negatively impacted by operational challenges, including derailments caused by rain-related flooding, cable theft and Eskom challenges.
Assmang and other manganese export producers continue to engage Transnet to seek improvement of the rail and port systems. To mitigate lower volume capacity at Transnet, export volumes were supplemented with 55 000 tonnes of ore transported via road during the year.
Production volumes at Black Rock Mine increased by 3% to 4.1 million tonnes (F2021: 4.0 million tonnes).
On-mine unit production costs and on-mine unit cash costs at Black Rock Mine decreased by 1% from R698 per tonne in F2021 to R694 per tonne in F2022. Despite significant above-inflation cost pressures, unit production and cash costs were lower due to the dilution of fixed costs as a result of increased production volumes, coupled with various on-mine cost-saving initiatives.
Unit production costs are expected to reduce further in real terms as the Black Rock Mine is modernised and optimised as part of the Black Rock and Gloria projects.
Unit costs of sales (which include marketing and distribution costs) increased by 13% due to higher sales and marketing costs (driven by higher revenue), a 63% increase in freight rates, as well as increased depreciation due to the Black Rock and Gloria projects moving to commissioning phase.
Total capital expenditure for the manganese ore operations was R2 133 million on a 100% basis (F2021: R2 060 million), of which R451 million (F2021: R845 million) relates to the Gloria Project. The increase in sustaining capital is primarily due to expenditure on battery electric vehicles, a new central control room, the Gloria Mine slimes facility and the dedicated reserve access and ventilation development costs.
At 30 June 2022, 92.5% of the approved capital of R3 billion was spent on the Gloria Project and 98.7% of the approved capital of R7.4 billion was spent on the Black Rock Project. The estimated date of completion for the Black Rock Project is September 2022.
Adverse ground conditions at Nchwaning III's Satellite Tip 2 necessitated extra secondary support which affected the completion date. The Nchwaning II Main Drive North system and Nchwaning III Satellite Tip 2 system will be commissioned and handed over to operations in September 2022. The Gloria surface plant and underground silo system and conveyors were successfully commissioned and handed over to operations in October 2021 and May 2022 respectively.
Completion dates for both the Gloria and Black Rock projects have been aligned with the production ramp-up plan, which has been carefully synchronised with the Transnet rail and export capacity and considers expected market conditions.
| unit | F2022 | F2021 | % change | |
| Volumes | ||||
| Export sales | 000t | 3 666 | 3 823 | (4) |
| Domestic sales* | 000t | 291 | 143 | 103 |
| Total sales | 000t | 3 957 | 3 966 | – |
| Production | 000t | 4 147 | 4 041 | 3 |
| Unit costs | ||||
| Change in on-mine production unit costs | % | (1) | 18 | |
| Change in unit cost of sales | % | 13 | 8 | |
| Capital expenditure | R million | 2 133 | 2 060 | 4 |
| * | Excluding intra-group sales of 168 000 tonnes sold to Cato Ridge Works (F2021: 187 000 tonnes). |
| R million | F2022 | F2021 | % change |
| Sales | 1 359 | 978 | 39 |
|---|---|---|---|
| Operating profit | 392 | 81 | >200 |
| Contribution to headline earnings | 1 017 | 37 | >200 |
| Capital expenditure | 44 | 94 | (53) |
| Depreciation | 5 | 29 | (83) |
| EBITDA | 397 | 110 | >200 |
The US dollar index price for high-carbon and medium-carbon manganese alloys increased by 76% and 101% respectively, mainly due to a temporary shortage of alloys in the market to meet the increased steel demand after the recovery from Covid-19 lockdowns.
High-carbon manganese alloy production at Sakura (100% basis) increased to 211 000 tonnes (F2021: 191 000 tonnes). Production in F2021 and F2022 was impacted by multiple transformer failures.
High-carbon manganese alloy sales (100% basis) decreased by 12% to 192 000 tonnes (F2021: 218 000 tonnes). The impact of the transformer failures was substantial during the first half of the year as only one furnace was operational. Consignment stock warehouses and pipelines had to be sufficiently re-stocked after the successful resumption of the non-operational furnace in October 2021.
High-carbon manganese alloy production at Cato Ridge Works decreased by 4% to 119 000 tonnes (F2021: 123 500 tonnes) mainly due to the challenges caused by the civil unrest and floods in KwaZulu-Natal, coupled with various operational challenges.
Medium-carbon manganese alloy production at Cato Ridge Alloys (100% basis) increased by 17% to 56 000 tonnes (F2021: 48 000 tonnes) and sales decreased by 14% to 50 000 tonnes (F2021: 58 000 tonnes). High-carbon manganese alloy sales at Cato Ridge Works decreased by 36% to 49 000 tonnes (F2021: 76 000 tonnes).
The decrease in manganese alloy sales was mainly attributable to shipping constraints and the lower demand for manganese alloy in the second half of the year.
Production costs at Sakura increased by 21% in F2022 due to significant increases in ore and reductant prices, offset by successful cost-saving initiatives implemented to further reduce fixed costs.
Production costs at Cato Ridge Works increased by 16% in F2022 mainly due to a reduction in production volumes, above-inflation power cost escalations and the variability of the ore grade. Medium-carbon manganese alloy production costs at Cato Ridge Alloys increased by 57% in F2022 primarily due to the increase in the cost for molten metal.
Capital expenditure for Cato Ridge Works decreased by 54% to R87 million (F2021: R188 million) after furnace-rebuild costs incurred in F2021.
| unit | F2022 | F2021 | % change | |
| Volumes | ||||
| Cato Ridge Works sales* | 000t | 49 | 76 | (36) |
| Cato Ridge Alloys sales | 000t | 50 | 58 | (14) |
| Sakura sales | 000t | 192 | 218 | (12) |
| Cato Ridge Works production | 000t | 119 | 124 | (4) |
| Cato Ridge Alloys production | 000t | 56 | 48 | 17 |
| Sakura production | 000t | 211 | 191 | 10 |
| Unit costs – Cato Ridge Works | ||||
| Change in unit production costs | % | 16 | 11 | |
| Change in unit cost of sales | % | 24 | 5 | |
| Unit costs – Cato Ridge Alloys | ||||
| Change in production unit costs | % | 57 | (1) | |
| Change in unit cost of sales | % | 37 | – | |
| Unit costs – Sakura | ||||
| Change in production unit costs | % | 21 | 1 | |
| Change in unit cost of sales | % | 21 | 1 |
| * | Excluding intra-group sales of 67 000 tonnes sold to Cato Ridge Alloys (F2021: 57 000 tonnes). |
The ARM Ferrous operations, held through its 50% investment in Assmang Proprietary Limited (Assmang), comprise the iron ore and manganese divisions. Assore Limited, ARM's partner in Assmang, owns the remaining 50%.
US dollar PGM prices were lower compared to record prices achieved in 2021, particularly palladium (9% lower) and rhodium (11% lower). The average rand per 6E kilogram basket price for Modikwa and Two Rivers declined by 10% and 8% to R1 319 104 per kilogram (F2021: R1 457 843 per kilogram) and R1 240 977 per kilogram (F2021: R 1 349 148 per kilogram), respectively.
| unit | F2022 | F2021 | % change | |
| Platinum | US$/oz | 1 003 | 1 046 | (4) |
|---|---|---|---|---|
| Palladium | US$/oz | 2 206 | 2 427 | (9) |
| Rhodium | US$/oz | 15 543 | 17 478 | (11) |
| Nickel | US$/t | 23 514 | 16 447 | 43 |
| Copper | US$/t | 9 644 | 8 086 | 19 |
| Cobalt | US$/lb | 32 | 18 | 78 |
| UG2 chrome concentrate – Two Rivers (CIF*) | US$/t | 184 | 137 | 34 |
| UG2 chrome concentrate – Modikwa (CIF*) | US$/t | 222 | – | |
| High-sulphur chrome concentrate – Nkomati (FOT*) | US$/t | – | 43 |
| * | CIF – cost, insurance and freight; FOT – free-on-truck. |
| unit | F2022 | F2021 | % change | |
| Average exchange rate | ZAR/US$ | 15.21 | 15.39 | (1) |
|---|---|---|---|---|
| Platinum | ZAR/oz | 15 247 | 16 107 | (5) |
| Palladium | ZAR/oz | 33 543 | 37 360 | (10) |
| Rhodium | ZAR/oz | 236 373 | 269 071 | (12) |
| Nickel | ZAR/t | 357 606 | 253 194 | 41 |
| Copper | ZAR/t | 146 672 | 124 482 | 18 |
| Cobalt | ZAR/lb | 483 | 283 | 70 |
| UG2 chrome concentrate – Two Rivers (CIF*) | ZAR/t | 2 791 | 2 107 | 32 |
| UG2 chrome concentrate – Modikwa (CIF*) | 3 371 | – | ||
| High-sulphur chrome concentrate – Nkomati (FOT**) | ZAR/t | – | 662 |
| * | CIF – cost, insurance and freight; FOT – free-on-truck. |
Two Rivers and Modikwa mines recognise revenue using provisional pricing. The sales price of the concentrate is determined on a provisional basis at the date of sale, with adjustments made to the sales price based on movements in the discounted forward commodity prices up to the date of final pricing. Post refining and delivery, adjustments are made to reflect final pricing.
Any differences between the provisional and final commodity prices after the reporting period result in the next reporting period's earnings being impacted by mark-to-market adjustments.
Realised mark-to-market adjustments – A portion of the ARM Platinum receivables as at 30 June 2021 was realised at lower prices after the sharp decline in rhodium and palladium prices in the first three months of the review period. This resulted in realised negative mark-to-market adjustments as shown in the table below.
Unrealised mark-to-market adjustments – Revenue related to open sales at 30 June at Two Rivers and Modikwa mines was initially recognised using provisional prices and subsequently revalued at 30 June per the tables below.
| Two Rivers Mine (R million) | F2022 | F2021 |
| Realised mark-to-market adjustments | (505) | 1 259 |
|---|---|---|
| Provisional sales value | 10 696 | 8 856 |
| Final sales value | 10 191 | 10 115 |
| Unrealised mark-to-market adjustments | (203) | (464) |
| Initial provisional sales recognition | 1 967 | 2 611 |
| Year-end provisional sales recognition | 1 764 | 2 147 |
| Total mark-to-market adjustments | (709) | 795 |
| Modikwa Mine (R million) | F2022 | F2021 |
| Realised mark-to-market adjustments | (165) | 468 |
|---|---|---|
| Provisional sales value | 4 860 | 3 784 |
| Final sales value | 4 695 | 4 252 |
| Unrealised mark-to-market adjustments | (65) | (169) |
| Initial provisional sales recognition | 1 181 | 1 458 |
| Year-end provisional sales recognition | 1 116 | 1 289 |
| Total mark-to-market adjustments | (231) | 299 |
| Average palladium and rhodium prices decreased by approximately 8% and 3% respectively from the date of provisional recognition to final price realisation, which together with movements in other PGM commodity prices, resulted in the realised mark-to-market adjustments. |
Tonnes milled improved significantly, increasing production volumes by 17% to 294 541 6E PGM ounces (F2021: 251 755 6E PGM ounces). The optimal blending of ore from normal stoping and on-reef development sources contributed positively to tonnes milled and consequently to PGM ounces.
Unit production costs increased below inflation by 2% to R14 644 per 6E PGM ounce (F2021: R14 300 per 6E PGM ounce) and correspondingly higher on a rand per tonne basis at R1 798 (F2021: R1 757). This is largely attributable to the 17% increase in production.
Capital expenditure at Modikwa Mine (100% basis) rose by 7% to R706 million (F2021: R660 million). Of this, 26% (R181 million) related to fleet refurbishment and critical spares, 23% (R164 million) to capital development, 9% (R60 million) to the Merensky project and 6% (R41 million) to the installation of a proximity detection system for the mining fleet.
North shaft project – level 9 infrastructure works have been completed. The main decline development has reached level 10 and the reef access decline is being established.
A downcast shaft to provide additional ventilation for mining of levels below level 10 will be established around level 9. The process to secure environmental approval for the access road and the shaft has advanced with approval envisaged in 1H F2023.
South 2 shaft project – South 2 shaft has ramped up to steady-state production. The shaft achieved an average production run rate of 66 738 tonnes per month, which is above the 55 000 ore tonnes per month target. Preparation work for the 2.5km underground-to-surface conveyor belt that will enable South 2 shaft to ramp-up production to 100 000 tonnes per month is currently taking place.
Merensky – the bord-and-pillar Merensky shaft was reopened on a trial basis after a pre-feasibility study that indicated a positive business case. The shaft was dewatered, and infrastructure established to enable ramp-up of production to 30 000tpm while confirming the project viability before commencing with the bankable feasibility study.
| unit | F2022 | F2021 | % change | |
| Cash operating profit | R million | 4 767 | 6 248 | (24) |
|---|---|---|---|---|
| – PGMs | R million | 4 749 | 6 248 | (24) |
| – Chrome | R million | 19 | – | – |
| Tonnes milled | Mt | 2.40 | 2.05 | 17 |
| Head grade | g/t 6E | 4.48 | 4.51 | (1) |
| PGMs in concentrate | 6E oz | 294 541 | 251 755 | 17 |
| Chrome in concentrate sold | Tonnes | 38 081 | – | – |
| Average basket price | ZAR/kg 6E | 1 319 104 | 1 457 843 | (10) |
| Average basket price | US$/oz 6E | 2 698 | 2 945 | (8) |
| Operating margin | % | 52 | 63 | |
| Operating cost | ZAR/kg 6E | 470 819 | 459 745 | 2 |
| Operating cost | ZAR/tonne | 1 798 | 1 757 | 2 |
| Operating cost | ZAR/Pt oz | 37 042 | 36 405 | 2 |
| Operating cost | ZAR/oz 6E | 14 644 | 14 300 | 2 |
| Operating cost | US$/oz 6E | 963 | 929 | 4 |
Tonnes milled were 5% higher compared to F2021 after commissioning of the additional mill capacity in December 2021. The grade, however, remains a constraint due to the split reef, as was reported previously. As a result, PGM production volumes increased marginally by 1% from 300 172 6E PGM ounces in F2021 to 301 935 6E PGM ounces in F2022. Following the accelerated development of the declines, mining flexibility is improving and enabling a better mining mix.
Two Rivers Mine unit production cost increased by 7% to R971 per tonne milled (F2021: R905 per tonne). The rand per 6E PGM ounce operating cost increased by 12% to R11 116 per ounce (F2021: R9 893 per ounce), primarily due to the utilisation of stockpiles which negatively impacted operating costs.
Of the R1 806 million spent at Two Rivers Mine, 41% (R748 million) was spent on the Merensky project as approved in F2021.
Deepening of the declines at Main and North shafts, along with electrical and mechanical installations, accounted for 23% (R405 million) of total capital expenditure. Additionally, 8% (R136 million) was spent on the tailings storage facility and 12% (R208 million) on mining fleet replacement.
The plant expansion project, which is expected to add 40 000 tonnes per month milling capacity, was approved in December 2019. The plant expansion was commissioned successfully and achieved its design run rate.
Construction of the new tailings storage facility was completed and it was commissioned in February 2022.
Two Rivers' shareholders approved the Two Rivers Merensky project to mine the Merensky Reef. Total estimated capital expenditure for the project is R5.7 billion (100% basis) which will be spent over three years. The project targets annual production of 182 000 6E PGM ounces, 1 600 tonnes of nickel and 1 300 tonnes of copper.
Mining of the Merensky Reef commenced as planned in February 2022 and it is ramping up after initial lower production rates. Surface earthworks in both the mining development and concentrator plant areas have commenced. The concentrator plant is scheduled to be commissioned in December 2023. The project completion date remains November 2024.
Capital expenditure of R824 million has been spent to date (14.3%), with R2 028 million (35.2%) committed to date.
| unit | F2022 | F2021 | % change | |
| Cash operating profit | R million | 5 981 | 8 949 | (33) |
|---|---|---|---|---|
| – PGMs | R million | 5 811 | 8 832 | (34) |
| – Chrome | R million | 170 | 118 | 44 |
| Tonnes milled | Mt | 3.46 | 3.28 | 5 |
| Head grade | g/t, 6E | 3.22 | 3.43 | (6) |
| PGMs in concentrate | Ounces, 6E | 301 935 | 300 172 | 1 |
| Chrome in concentrate sold | Tonnes | 214 735 | 242 945 | (12) |
| Average basket price | ZAR/kg, 6E | 1 240 977 | 1 349 148 | (8) |
| Average basket price | US$/oz, 6E | 2 533 | 2 724 | (7) |
| Operating margin | % | 62 | 73 | (15) |
| Operating cost | ZAR/kg, 6E | 357 375 | 318 075 | 12 |
| Operating cost | ZAR/tonne | 971 | 905 | 7 |
| Operating cost | ZAR/Pt oz | 23 917 | 21 341 | 12 |
| Operating cost | ZAR/oz, 6E | 11 116 | 9 893 | 12 |
| Operating cost | US$/oz, 6E | 731 | 643 | 14 |
Nkomati Mine was placed on care and maintenance on 15 March 2021. ARM is evaluating various options regarding the way forward for the mine.
At 30 June 2022, the estimated undiscounted rehabilitation costs attributable to ARM were determined to be R771 million (30 June 2021: R679 million) excluding VAT. The discounted rehabilitation costs attributable to ARM were determined to be R676 million (30 June 2021: R596 million). The increase in the undiscounted liability of R92 million is attributed mainly to annual escalation increases and the impact of the increase in the diesel price from R14.66/l in June 2021 compared to R23.09/l in June 2022.
At 30 June 2022, R178 million (attributable to ARM) in cash and financial assets was available to fund rehabilitation obligations for Nkomati Mine. The resulting attributable shortfall in discounted rehabilitation costs of R498 million is expected to be funded by ARM.
Nkomati Mine's estimated rehabilitation costs continue to be reassessed as engineering designs evolve and new information becomes available.
US dollar prices for thermal coal reached record levels in F2022 largely due to disruptions in the global coal supply market following geopolitical turbulence owing to the conflict between Russia and Ukraine. Sanctions on Russia have increased European demand for South African coal. This was also exacerbated by Asian liquefied natural gas (LNG) prices reaching record levels (prompting a switch from gas to coal). Prices were further supported by the Indonesia ban on coal exports, which was subsequently lifted in January 2022.
The average received export US dollar price for the Goedgevonden Mine increased by 195% to US$168 per tonne in F2022 (F2021: US$57 per tonne). The average received export US dollar price for PCB increased by 182% from US$57 per tonne in F2021 to US$161 per tonne in F2022.
Approximately 60% of export volumes at Goedgevonden Mine comprised high-quality coal, while PCB's exports of high-quality coal totalled 69%.
| R million | F2022 | F2021 | % change |
| Cash operating profit | 1 525 | 148 | >200 |
|---|---|---|---|
| Amortisation and depreciation | (190) | (182) | (4) |
| Imputed interest* | (120) | (170) | 29 |
| Profit on sale of assets | 4 | – | – |
| Loan re-measurement and fair value (losses)/gains | (786) | 206 | – |
| Profit before taxation | 434 | 2 | >200 |
| Less: Profit on sale of assets | (4) | – | – |
| Less: Taxation | (435) | 8 | – |
| Headline (loss)/earnings attributable to ARM | (5) | 10 | – |
| * | Post restructuring the ARM Coal loans, all interest expense on partner loans is imputed. |
Total sales volumes increased by 11% as the Goedgevonden Mine reduced the impact of TFR's underperformance by trucking coal to other ports. ARM attributable saleable production increased by 9% to 1.65 million tonnes from 1.5 million tonnes in F2021.
On-mine production unit costs per saleable tonne were flat at R508 per tonne (F2021: R506 per tonne).
| Unit | F2022 | F2021 | % change | |
| Total production and sales (100% basis) | ||||
| Saleable production | Mt | 6.33 | 5.79 | 9 |
| Export thermal coal sales | Mt | 3.93 | 3.89 | 1 |
| Domestic thermal coal sales | Mt | 2.47 | 1.90 | 30 |
| ARM attributable production and sales | ||||
| Saleable production | Mt | 1.65 | 1.50 | 10 |
| Export thermal coal sales | Mt | 1.02 | 1.01 | 1 |
| Domestic thermal coal sales | Mt | 0.64 | 0.49 | 31 |
| Average received coal price | ||||
| Export (FOB)* | US$/t | 167.72 | 56.73 | 196 |
| Domestic (FOT)** | ZAR/t | 371 | 354 | 5 |
| Unit costs | ||||
| On-mine saleable cost | ZAR/t | 508 | 506 | 0 |
| Capital expenditure | R million | 422 | 1 011 | (58) |
| * FOB – free-on-board. ** FOT – free-on-truck. |
| Rounding of figures may result in minor computational discrepancies. |
| R million | F2022 | F2021 | % change |
| Cash operating profit | 2 801 | 299 | >200 |
|---|---|---|---|
| Imputed interest | (87) | (104) | (16) |
| Amortisation and depreciation | (702) | (569) | 23 |
| Loan re-measurement (loss)/gain | (490) | 36 | |
| Loss on sale of assets | (9) | – | – |
| Impairment reversal | 748 | – | – |
| Profit/(loss) before taxation | 2 261 | (338) | – |
| Less: Impairment reversal | (739) | – | – |
| Less: Taxation | (589) | 78 | |
| Headline earnings/(loss) attributable to ARM | 933 | (260) | – |
Export sales volumes were 22% higher at 9.8 million tonnes (F2021: 8 million tonnes). Domestic sales volumes declined by 64% from 2.9 million tonnes to 1.04 million tonnes due to the expiry of certain domestic contracts.
Production at the PCB operations was negatively impacted by operational challenges at Transnet, resulting in high product stockpiles. ARM attributable saleable production was 2.06 million tonnes in F2022 compared to 2.34 million tonnes in F2021.
Unit production costs per saleable tonne increased from R520 per tonne in F2021 to R633 per tonne in F2022. The 22% increase in unit costs is due to the lower saleable production, together with above-inflation diesel and explosives price increases.
| unit | F2022 | F2021 | % change | |
| Total production sales (100% basis) | ||||
| Saleable production | Mt | 10.18 | 11.58 | (12) |
| Export thermal coal sales | Mt | 9.79 | 8.00 | 22 |
| Domestic thermal coal sales | Mt | 1.04 | 2.90 | (64) |
| ARM attributable production and sales | ||||
| Saleable production | Mt | 2.06 | 2.34 | (12) |
| Export thermal coal sales | Mt | 1.98 | 1.62 | 22 |
| Domestic thermal coal sales | Mt | 0.21 | 0.59 | (64) |
| Average received coal price | ||||
| Export (FOB)* | US$/t | 160.54 | 56.97 | 182 |
| Domestic (FOT)** | ZAR/t | 558 | 678 | (18) |
| Unit costs | ||||
| On-mine saleable cost | ZAR/t | 633 | 520 | 22 |
| Capital expenditure | R million | 1 126 | 1 226 | (8) |
| * FOB – free-on-board. ** FOT – free-on-truck. |
ARM's economic interest in PCB is 20.2%. PCB consists of two large mining complexes in Mpumalanga.
ARM has a 26% effective interest in the Goedgevonden Mine near Ogies in Mpumalanga.
ARM's investment in Harmony was negatively revalued by R59 million in F2022 (F2021: R1 426 million negative revaluation) as the Harmony share price decreased by 1% from R52.76 per share at 30 June 2021 to R51.97 per share at 30 June 2022. The Harmony investment is therefore reflected on the ARM statement of financial position at R3 881 million based on its share price at 30 June 2022.
Gains and losses are accounted for, net of deferred capital gains tax, through the statement of comprehensive income. Dividends from Harmony are recognised in the ARM statement of profit or loss on the last day of registration following dividend declaration.
Harmony's results for the year ended 30 June 2022 can be found on its website: www.harmony.co.za
Increasing global debt levels, a recovery in global supply chains following Covid-19-related disruptions, intermittent Covid-19 lockdowns in China, rising global inflation, and a dislocation in energy markets following geopolitical turbulence owing to the conflict between Russia and Ukraine have all contributed to heightened levels of uncertainty in commodity and capital markets over the past year. In addition, accelerated tightening of interest rates in developed markets and recession risks in the US and Europe have compounded volatility.
After starting off the 2022 financial year at over US$200 per tonne, iron ore prices fell to below US$100 per tonne in December 2021. Prices have since recovered, stabilising around the US$110 to US$120 per tonne level. The iron ore market is expected to be largely balanced for calendar year 2022, which supports current price stability. Concerns remain, however, that increased iron ore supply from major producers and pressure on China's crude steel production are likely to move the market into surplus into 2023 and beyond, placing downward pressure on prices. Our focus remains on cost containment and improving our global cost position, as well as ensuring that our iron ore operations benefit from the move to reduce carbon emissions in the steel industry globally, which in turn is expected to result in greater demand for high-quality lumpy iron ore products.
Similarly, in manganese ore, the significant investment undertaken over the last ten years in Black Rock Mine is expected to position the mine to deliver high-quality manganese ore into a seaborne market whose supply of high-grade manganese ore is expected to be constrained.
In PGMs, a recovery in autocatalyst demand and tightening emission standards are expected to be positive for PGM demand in the short to medium term. We are cognisant of the threat that battery electric vehicles may have on PGM demand. PGMs, however, particularly platinum, are expected to play a significant role in clean mobility (through hydrogen technology) alongside battery electric vehicles. Constrained growth in supply is also expected to result in robust fundamentals for PGM markets and therefore provide price support. We are pleased with the progress that Modikwa and Two Rivers mines have made in improving their position on the global PGM unit cost curve in recent years.
ARM's confidence in the fundamentals of the PGM sector is evidenced through its recent acquisition of Bokoni Platinum Mine which is the second-largest PGM resource in South Africa. This is an opportunity to develop Bokoni Mine's large, high-grade resource which will enable ARM to scale its PGM portfolio, improve its global competitiveness and pursue further value-accretive organic growth.
The success of ARM's operations relies heavily on the efficient provision of utilities and logistics infrastructure within South Africa. Although there are numerous challenges in the performance of logistics channels, the reliable supply of power, and water security, we are working with government and all stakeholders to find sustainable solutions that benefit the mining sector and the country.
These and other input cost escalations are expected to continue putting pressure on unit costs across the South African mining industry. In the period under review many of our input costs including freight, diesel, explosives, reductants and consumables, experienced increases that were much beyond inflation impacted by global market disruptions. These cost elements remain susceptible to prevailing market conditions. We continue to implement various efficiency and cost-containment initiatives at our operations to mitigate against above-inflation unit cost increases.
We remain fully committed to mutually beneficial relationships with all our stakeholders to ensure that we build a resilient and sustainable business that delivers competitive returns for shareholders.
ARM aims to pay ordinary dividends to shareholders in line with our dividend guiding principles. Dividends are at the discretion of the board of directors which considers the company's capital allocation guiding principles as well as other relevant factors such as financial performance, commodities outlook, investment opportunities, gearing levels as well as solvency and liquidity requirements of the Companies Act.
For F2022, the board approved and declared a final dividend of 2 000 cents per share (gross) (F2021: 2 000 cents per share). The amount to be paid is approximately R4 493 million.
The dividend declared will be subject to dividend withholding tax. In line with paragraphs 11.17(a) (i) to (x) and 11.17(c) of the JSE Listings Requirements, the following additional information is disclosed:
A gross dividend of 2 000 cents per ordinary share, being the final dividend for the financial year ended 30 June 2022, has been declared payable on Monday, 3 October 2022 to those shareholders recorded in the books of the company at the close of business on Friday, 30 September 2022. The dividend is declared in the currency of South Africa. Any change in address or dividend instruction applying to this dividend must be received by the company's transfer secretaries or registrar not later than Friday, 30 September 2022. The last day to trade ordinary shares cum dividend is Tuesday, 27 September 2022. Ordinary shares trade ex-dividend from Wednesday, 28 September 2022. The record date is Friday, 30 September 2022 while the payment date is Monday, 3 October 2022.
No dematerialisation or rematerialisation of share certificates may occur between Wednesday, 28 September 2022 and Friday, 30 September 2022, both dates inclusive, nor may any transfers between registers take place during this period.
There has been no material change to ARM's Mineral Resources and Mineral Reserves as disclosed in the integrated annual report for the financial year ended 30 June 2021, other than depletion due to continued mining activities at the operations. An updated Mineral Resources and Mineral Reserves statement will be issued in our 2022 integrated annual report.
On 20 December 2021, ARM announced that it had entered into a sale and purchase agreement to acquire all the shares of Bokoni Platinum Mines Proprietary Limited. Bokoni Mine is located in the Eastern Limb of the Bushveld Complex in the Limpopo province of South Africa.
All the conditions precedent to the Bokoni Mine transaction have now been fulfilled as announced on 12 August 2022. The details of the Mineral Resources and/or Mineral Reserves of this asset will be reported by ARM during F2023.
The condensed group financial statements set out on pages 25 to 56 for the financial year ended 30 June 2022 have been reviewed by the company's registered auditor, Ernst & Young Inc. (the partner in charge is PD Grobbelaar CA(SA)) who expressed an unmodified conclusion on these results. The full review report can be found on the ARM website at www.arm.co.za or at our registered offices.
Signed on behalf of the board:
PT Motsepe
Executive Chairman
MP Schmidt
Chief Executive Officer
Johannesburg
1 September 2022