
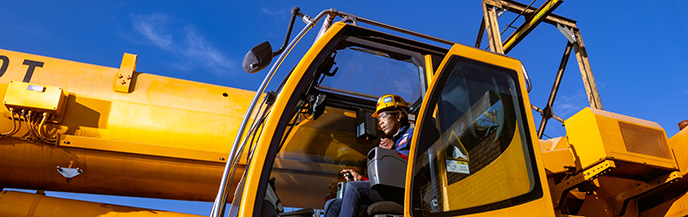
ARM remains committed to ensuring a safe and healthy work environment for all employees and to achieving our goal of zero harm. The total recordable injury frequency rate (TRIFR1) regressed by 2% to 0.51 (F2024: 0.50), and the group’s lost-time injury frequency rate (LTIFR) regressed by 41% to 0.31 per 200 000 man-hours (F2024: 0.22).
1 TRIFR includes the number of fatal injuries, the number of lost-time injuries, and the number of medical treatment cases.
Regrettably, there were three fatalities recorded in F2025 (F2024: one).
On 29 November 2024, Mr Tshepo Tebelo was fatally injured in a winch-related incident at Modikwa Mine.
On 27 December 2024, Mr William Kodibona succumbed to injuries related to an underground rigging accident at Bokoni Mine.
On 18 April 2025, Mr Stanley Kgotlayame Mongale, was fatally injured in a fall-of-ground (FOG) incident at Black Rock Mine.
We extend our deepest condolences to the affected family members, friends and colleagues of the deceased.
Support and counselling were provided to all affected families and colleagues of the deceased through the employee assistance programme. Independent root cause investigations were undertaken. Continuous efforts are in place to strengthen safety measures and improve overall safety performance.
Safety achievements in F2025 included:
ARM continues to implement an integrated wellness management programme in all our operations to prevent occupational health hazards from affecting employee health. The programme actively identifies and manages health risks and chronic conditions that may affect wellness and quality of life. 25 cases of noise-induced hearing loss (NIHL) were submitted for compensation in F2025 (F2024: 23). These cases were at Beeshoek (one), Khumani (five), Bokoni (one), Two Rivers (five) and Modikwa (13). The cases have been reported to the Department of Mineral and Petroleum Resources (DMPR) and submitted to Rand Mutual Assurance (RMA) for possible compensation.
Hearing conservation continues to be a focus of occupational health surveillance and management programmes. Operations have several initiatives to reduce noise exposure, such as providing customised hearing protection devices (HPDs) to exposed employees and ensuring that all machines at the operations are below the milestone level of 104 A-weighted decibels (dB).
At the end of F2023, ARM published its short-term target (F2026) and medium-term target (F2030) of a 15% and a 30% reduction in scope 1 and scope 2 emissions, respectively. Decarbonisation pathways identified included improving energy efficiencies, implementing renewable energy and the use of new energy vehicles. At the end of F2025, we achieved a 13% reduction in scope 1 and 2 emissions against the F2023 baseline. We are still on track to achieve a 15% reduction in scope 1 and 2 emissions by F2026 against the F2023 baseline.
Greenhouse gas (GHG) emissions performance1
Below is the comparison of F2025 and F2024 scope 1 and 2 emissions. Scope 1 and 2 emissions decreased by 7% mainly due to a decrease in production.
Comparison of F2025 and F2024 scope 1 and scope 2 emissions
| Tonnes of carbon dioxide equivalents (tCO2e) | F2025 | F2024 | % change |
| Scope 1 | 346 918 | 364 795 | (5) |
|---|---|---|---|
| Scope 2 | 1 222 471 | 1 330 731 | (8) |
| Scope 1 and 2 | 1 569 389 | 1 695 526 | (7) |
Scope 1: greenhouse gas (GHG) emissions released directly by an organisation through its activities, eg diesel, petrol, etc. |
1 At the time of publication, the F2025 environmental, social, and governance (ESG) assurance audit was ongoing.
In December 2023, the International Council on Mining and Metals (ICMM) published its Scope 3 Emissions Target Setting Guidance, which has been developed to support mining and metals companies in setting targets to reduce scope 3 (value chain) emissions. In F2024, we set qualitative scope 3 targets with a commitment to set quantitative targets by F2027. Work is underway to develop the quantitative targets.
As at the end of June 2025, construction of the solar plant reached completion. The remaining activity is the commissioning phase, which is scheduled to take approximately two months. The project is on track for completion by Q2 F2026, at which point electricity from the plant will be supplied to the mining operations. Once fully operational, the renewable PPA is expected to contribute approximately 30% of ARM Platinum’s total energy consumption from renewable sources.
The renewable energy definitive feasibility study (DFS) was completed in December 2024. Given the uncertainty surrounding future Eskom tariff structures, which could affect the viability of a standalone photovoltaic (PV) plant, ARM Ferrous has opted to explore contracting with an independent power producer (IPP). This approach, like that adopted by the ARM Platinum division, will be pursued on a medium-term basis while the new multi-market model for energy supply and procurement is finalised.
Water supply to Assmang’s Khumani Mine remained consistent during the second half of the year with no significant operational disruptions caused by water shortages.
On 1 July 2025 consulting engineers were appointed by the Vaal Gamagara Water User Association to conduct specialist studies and execute the engineering design of key component projects within the Phase 2 Vaal Gamagara pipeline Project (Phase 2 Project). The preliminary funding structure and related market sounding in respect of the Phase 2 Project commenced in H2 F2025 and is expected to be completed in H1 F2026.
Khumani has secured agreements with neighbouring mines to supplement its water requirement and, furthermore, is exploring various initiatives to optimise water efficiency to mitigate risks in the short to medium term. The long-term solution is the urgent completion of the Phase 2 Project of the Vaal Gamagara Pipeline which is being addressed as a key priority.
ARM, as a member of the ICMM, remains committed to operating tailings storage facilities (TSF) in line with global best practices as set out by the Global Industry Standard on Tailings Management (GISTM) and company policies.
ARM submitted its GISTM conformance results and public disclosure document for all its TSFs that are classified as ‘low’ and ‘extreme’ on 5 August 2025. The TSFs at Black Rock and Beeshoek declared their GISTM conformance for the first time on 5 August 2025 as their Consequence Classification of Structures (CCS) ranges from ‘low’ to ‘significant’. Reviews by the independent tailings review boards are ongoing to assess the safety of the TSFs in terms of design, operation and performance against the design intent.
Extensive work was carried out during the period and is ongoing to ensure that Modikwa’s TSF complies with industry and internal standards. As part of this work, Modikwa commissioned an intensive geotechnical investigation to evaluate the characteristics of both the foundation material and tailings to assess how best to improve the stability of the TSF under certain potential extreme conditions over the remaining life of the TSF to 2051.
An independently led detailed risk assessment has been commissioned by Modikwa’s management to ensure that all potential stability risks are identified and that ongoing risks are managed within risk appetite and tolerance.
Pending the outcome of the pilot shear key construction and the material characterisation, Valterra Platinum and ARM are considering additional safety measures to improve the stability of the TSF at Modikwa for the long term.
We maintained our robust financial position with net cash of R6 609 million at 30 June 2025 (F2024: R7 197 million). This gives ARM the flexibility to pursue value-enhancing growth prospects.
In F2025, total value created was R12 156 million (F2024: R12 431 million) on a segmental basis. This was distributed to stakeholders and reinvested in our business, as shown below.
| F2025 Rm |
F2024 Rm |
|
| Salaries and fringe benefits to employees | 6 188 | 5 106 |
|---|---|---|
| Taxes to government | 2 435 | 2 332 |
| Income tax | 1 798 | 1 608 |
| Royalty tax | 637 | 724 |
| Finance costs, dividends and non-controlling interest to capital providers | 3 328 | 3 003 |
| Dividends | 2 644 | 3 529 |
| Non-controlling interest | 179 | (850) |
| Finance costs | 505 | 324 |
| Total value distributed | 11 951 | 10 441 |
| Reinvested in the group | 205 | 1 990 |
| Amortisation | 2 519 | 2 373 |
| Reserves retained | (2 314) | (383) |
| Total value | 12 156 | 12 431 |
Headline earnings for F2025 decreased by 47% to R2 695 million or R13.79 per share (F2024: R5 080 million or R25.91 per share). The decline in headline earnings was mainly due to a decrease in the average realised export US dollar iron ore prices and increased mechanised development costs at Bokoni.
The average realised rand strengthened by 3% versus the US dollar to R18.15/US$ compared to R18.70/US$ in F2024. For reporting purposes, the closing exchange rate at 30 June 2025 was R17.77/US$ (30 June 2024: R18.25/US$).
Headline earnings/(loss) by operation/division
| F2025 Rm |
F2024 Rm |
% change |
|
| ARM Ferrous | 3 472 | 5 058 | (31) |
|---|---|---|---|
| Iron ore division | 3 160 | 4 933 | (36) |
| Manganese division | 315 | 143 | 120 |
| Consolidation adjustment | (3) | (18) | 83 |
| ARM Platinum | (1 288) | (910) | (42) |
| Two Rivers Mine | 202 | 168 | 20 |
| Modikwa Mine | (43) | (121) | 64 |
| Bokoni Mine | (1 392) | (566) | (146) |
| Nkomati Mine | (55) | (391) | 86 |
| ARM Coal | 47 | 391 | (88) |
| Goedgevonden Mine (GGV) | 134 | 331 | (60) |
| PCB operations* | (87) | 60 | >(200) |
| ARM Corporate and other | 464 | 541 | (14) |
| Corporate and other (including gold) | 558 | 762 | (27) |
| Machadodorp Works | (94) | (221) | 57 |
| Headline earnings | 2 695 | 5 080 | (47) |
* PCB refers to Participative Coal Business.
ARM Ferrous headline earnings were 31% lower at R3 472 million (F2024: R5 058 million), driven by a 36% decrease in headline earnings in the iron ore division. This was partially offset by a 120% increase in headline earnings in the manganese division.
Lower headline earnings in the iron ore division were mainly driven by a decrease in the average realised export US dollar iron ore prices, lower local sales volumes, as well as the stronger rand/US dollar exchange rate.
Higher headline earnings in the manganese division were driven by an increase in manganese ore sales volumes and average manganese ore sales prices.
ARM Platinum reported a headline loss of R1.3 billion (F2024: R910 million loss), largely due to higher operational losses at Bokoni.
Two Rivers Mine headline earnings increased by 20% to R202 million (F2024: R168 million), mainly due to a 2% improvement in the average PGM rand basket price. The mine’s production decreased marginally, while unit cash costs (rand per 6E PGM ounce) increased by 5%.
Modikwa Mine reported a headline loss of R43 million (F2024: R121 million loss). The mine’s production decreased by 3%, while unit cash cost (rand per 6E PGM ounce) increased by 3%.
Bokoni Mine reported a headline loss of R1.4 billion (F2024: R566 million). In the current year Bokoni ramped up its operations, however, it was negatively impacted by operational challenges, high fixed costs associated with the early ounce production and increased mechanised development costs.
For more detail and a table showing the mark-to-market adjustments at Two Rivers, Modikwa and Bokoni mines, refer to operational performance.
Nkomati Mine reported an attributable headline loss of R55 million (F2024: R391 million). The headline loss decreased due to the F2024 headline loss being negatively impacted by an increase in rehabilitation liabilities relating to water management costs.
ARM Coal headline earnings decreased by 88% to R47 million (F2024: R391 million), driven mainly by a reduction in the realised coal price as well as lower saleable volumes from GGV and PCB.
GGV Mine’s headline earnings were R134 million (F2024: R331 million). PCB recorded a headline loss of R87 million (F2024: R60 million headline earnings).
Refer to operational performance for a detailed analysis of the GGV and PCB operational profit performance.
ARM Corporate and other (including gold) reported headline earnings of R558 million (F2024: R762 million). Included in ARM Corporate and other are dividends received from Harmony of R240 million (F2024: R166 million) and management fees received from Assmang of R1 366 million (F2024: R1 503 million).
Machadodorp Works headline loss of R94 million (F2024: R221 million) related to research on developing energy-efficient smelting technology.
Basic earnings of R330 million (F2024: R3 146 million) included attributable impairments as follows:
Refer to note 4 of the condensed group financial statements for further details on these impairments.
At 30 June 2025, ARM had net cash of R6 609 million (30 June 2024: R7 197 million), a decrease of R588 million compared to the end of F2024. This amount excludes attributable cash and cash equivalents held at ARM Ferrous (50% of Assmang) of R3 568 million (30 June 2024: R4 476 million). There was no debt at ARM Ferrous in either of the reporting periods.
Dividends received by ARM Corporate
| F2025 Rm |
F2024 Rm |
|
| Assmang | 4 500 | 5 000 |
|---|---|---|
| ARM Coal | 462 | 422 |
| Harmony Gold | 240 | 166 |
| Total dividends received | 5 202 | 5 588 |
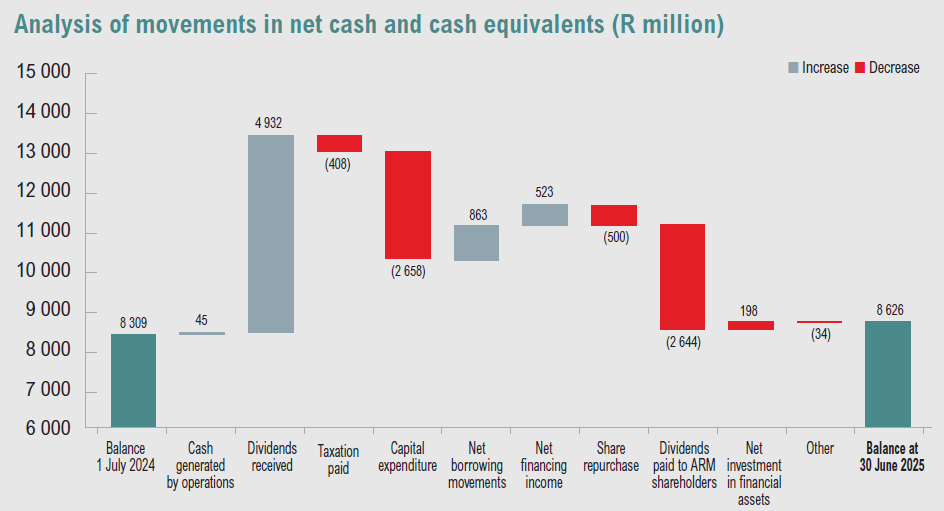
Cash generated from operations decreased by R1 726 million to R45 million (F2024: R1 771 million) after an outflow in working capital of R1 214 million (F2024: R130 million outflow). This was mainly due to an outflow in trade payables and a reduction in receivables inflow.
In F2025, ARM paid R2 644 million in dividends to its shareholders, representing the interim dividend of R4.50 and final dividend of R9.00 per share declared for F2024 (F2024: R3 529 million representing the interim dividend of R6.00 and F2023 final dividend of R12.00 per share).
Net cash outflow from investing activities was R2 433 million (F2024: R6 556 million) and included R2 658 million (F2024: R6 292 million) additions to property, plant and equipment.
Borrowings of R62 million (F2024: R62 million) were repaid, and borrowings of R925 million were raised during the period, resulting in gross debt of R2 035 million at 30 June 2024 (30 June 2024: R1 129 million).
Implementation of a hedging collar transaction over 24% of ARM’s equity in Harmony
ARM implemented a hedging collar transaction involving 18 million shares in Harmony Gold, representing 24% of its equity in Harmony. The collar and related arrangements provide ARM with access to future funding on efficient terms while retaining partial upside exposure. The structure includes a put option at R234.85 and a call option at R562.40, both maturing in June 2030.
ARM remains fully committed to Harmony as a strategic investment and remains confident in Harmony and its management’s ability to drive growth and value for its shareholders.
Please refer to the announcement released on the Stock Exchange News Service (SENS) on 11 June 2025 for further details.
Delisting of ordinary shares pursuant to a general repurchase and intra-group distribution of ARM treasury shares
ARM, in accordance with the general authority granted by shareholders at the company’s annual general meeting held on 6 December 2024, has cumulatively repurchased and cancelled 3 239 681 ordinary shares, at an average price of R154.27 per share, totalling approximately R499.8 million. Additionally, ARM’s subsidiary, Opilac, distributed 12 717 328 treasury shares in specie back to ARM, which were cancelled and delisted. These actions reduced the total issued share capital by 7% to 208 710 769 ordinary shares. The cancellation of the treasury shares has no impact on the earnings per share and headline earnings per share of ARM.
Please refer to the announcement released on SENS on 20 June 2025 for further details.
Closure of Cato Ridge Works and Alloys, disposal of certain land assets of Assmang and Assmang’s interest in Sakura
ARM has announced a series of strategic transactions involving its 50% stake in the joint venture, Assmang. These include the permanent closure of the Cato Ridge Works plant, effective 31 August 2025. Assmang will also sell various land, properties and houses in Cato Ridge to Assore S.A. PropCo Proprietary Limited for R453 million, with part of the land designated for community benefit. Additionally, Assmang will dispose of its 54.36% stake in Sakura Ferroalloys to Assore, resulting in a cash distribution of R900 million to ARM.
Please refer to the announcement released on SENS on 30 June 2025 for further details.
Surge Copper
ARM has entered into a subscription agreement to acquire 25.8 million common shares of Surge Copper Corp through a non-brokered private placement for a total consideration of approximately C$4.5 million.
This follows ARM’s earlier exercise of its rights under an investor rights agreement, where it purchased 1.6 million shares for C$0.24 million in a top-up offering. Prior to these transactions, ARM held 43.0 million shares (13.4% of Surge’s issued shares), and upon completion of the private placement, its shareholding will increase to 68.7 million shares, representing 19.9% of the company on a non-diluted basis. Surge Copper has made strong progress on the pre-feasibility study, which remains on track for completion in 2026.
Please refer to the announcement released on SENS on 15 August 2025 for further details.
Bokoni Mine
Operations at Bokoni were suspended at the end of F2025, with current mining and milling capacity proving insufficient to offset fixed costs and sustain profitability. Ore reserve development is advancing to support a phased ramp-up to 240 thousand tonnes per month (ktpm) production rate, regarded as the optimum throughput to unlock economies of scale and deliver sustainable returns.
This strategy is anchored by Bokoni’s large, high-grade Mineral Resource, which positions the mine competitively on the cost curve at steady state production. To accelerate cash generation and reduce funding needs, the existing 60ktpm concentrator will be restarted ahead of the new 120ktpm plant, with timing carefully sequenced to ore availability and ramp-up milestones.
We remain confident that this strategy is the right approach to unlock value from Bokoni’s exceptional resource base while exercising strict capital discipline, considering ongoing commodity price uncertainty.
Existing operations
We continued to invest in our existing operations with segmental capital expenditure of R4 050 million for the period (F2024: R8 564 million). The decrease in capital expenditure was mainly due to F2024, including capital expenditure for the Merensky project at Two Rivers Mine. Capital expenditure for the divisions is shown below and discussed in each division’s operational performance section.
Capital expenditure by operation/division (attributable basis)
| F2025 Rm |
F2024 Rm |
% change |
|
| ARM Ferrous | 1 767 | 2 209 | (20) |
|---|---|---|---|
| Iron ore division | 1 341 | 1 607 | (17) |
| Manganese division | 506 | 697 | (27) |
| Consolidation adjustment | (80) | (95) | 16 |
| ARM Platinum | 1 978 | 6 139 | (68) |
| Two Rivers Mine | 1 193 | 3 968 | (70) |
| Modikwa Mine | 222 | 417 | (47) |
| Bokoni Mine | 563 | 1 754 | (68) |
| ARM Coal (GGV Mine only) | 275 | 202 | 36 |
| ARM Corporate | 30 | 14 | 114 |
| Total | 4 050 | 8 564 | (53) |
Prices
Average realised US dollar export iron ore prices were 15% lower on a free-on-board (FOB) equivalent basis at US$93 per tonne (F2024: US$109 per tonne). The lump-to-fines ratio increased from 57:43 in F2024 to 58:42 in F2025.
Movements in iron ore prices resulted in the following mark-to-market adjustments:
| F2025 Rm |
F2024 Rm |
|
| Fair value adjustments during the year (realised) | (559) | (606) |
|---|---|---|
| Revenue – fair value adjustments current period | (401) | (740) |
| Revenue – fair value adjustments previous period | (158) | 134 |
| Fair value adjustments at year end (unrealised) | (355) | (44) |
| Based on confirmed prices | (142) | 57 |
| Based on forward prices | (213) | (101) |
| Total revenue – fair value adjustments | (914) | (650) |
| Realised fair value adjustments for the period | (559) | (606) |
| Unrealised fair value adjustments for the period | (355) | (44) |
Volumes
Total iron ore production volumes increased by 3% to 14.5 million tonnes (F2024: 14.1 million tonnes), due to improved water supply.
Total iron ore sales volumes decreased by 3% to 14.3 million tonnes (F2024: 14.7 million tonnes). Export sales volumes remained stable at 12.2 million tonnes (F2024: 12.2 million tonnes), while local sales volumes decreased by 18% to 2.0 million tonnes (F2024: 2.4 million tonnes), driven by lower offtake from Beeshoek’s sole local customer.
Water supply remained consistent during the second half of the year with no significant operational disruptions.
Unit costs
Unit cash costs of the iron ore division increased by 3% to R522 per tonne (F2024: R507 per tonne) mainly due to the lower production volumes at Beeshoek Mine and higher plant and mining maintenance expenses, partially offset by lower diesel prices and higher production volumes at Khumani Mine.
Khumani Mine’s unit cash cost increased marginally by 1% to R491 per tonne (F2024: R485 per tonne). Inflationary increases were offset by lower diesel prices and higher mining production.
Beeshoek Mine’s unit cash costs increased by 14%, mainly due to lower production volumes and higher repair and maintenance costs. These increases were partially offset by reduced diesel prices. The increase in repair and maintenance costs was largely attributable to the delayed replacement of the mining fleet, due to ongoing uncertainty regarding the securing of a long-term offtake agreement.
Unit cost of sales for the iron ore division, which includes marketing and distribution costs, increased by 6%. This was mainly due to a lower proportion of mining costs being capitalised as stripping assets, as a result of reduced stripping ratios at both Khumani and Beeshoek mines, resulting in an increase in the cost of sales. The increase was further compounded by higher inland logistics costs due to higher rail tariffs at Khumani.
Capital expenditure
Capital expenditure (100% basis) was R2 681 million (F2024: R3 215 million), which includes capitalised waste-stripping costs of R848 million (F2024: R1 335 million).
Khumani Mine’s capital expenditure (100% basis) decreased by 11% to R2 296 million (F2024: R2 573 million), mainly due to lower waste-stripping costs capitalised.
Beeshoek Mine’s capital expenditure (100% basis) decreased by 40% to R385 million (F2024: R642 million), mainly due to lower waste-stripping costs capitalised of R56 million (F2024: R393 million).
Iron ore operational statistics (100% basis)
| Unit | F2025 | F2024 | % change | |
| Prices | ||||
| Average realised export price* | US$/t | 93 | 109 | (15) |
| Volumes | ||||
| Export sales | 000t | 12 260 | 12 241 | – |
| Local sales | 000t | 2 030 | 2 482 | (18) |
| Total sales | 000t | 14 290 | 14 722 | (3) |
| Production | 000t | 14 567 | 14 146 | 3 |
| Export sales lump/fines split | % | 58:42 | 57:43 | |
| Export sales CIF/FOB** split | % | 43:57 | 47:53 | |
| Unit costs | ||||
| Change in unit cash costs | % | 3 | 5 | |
| Change in unit cost of sales | % | 6 | 7 | |
| Capital expenditure | R million | 2 681 | 3 215 | (17) |
* Average realised export iron ore prices on an FOB equivalent basis.
** CIF – cost, insurance and freight; FOB – free-on-board.
Manganese ore financial information (attributable basis)
| F2025 Rm |
F2024 Rm |
% change |
|
| Sales | 6 514 | 5 874 | 11 |
|---|---|---|---|
| Operating profit | 753 | 372 | 102 |
| Contribution to headline earnings | 543 | 246 | 121 |
| Capital expenditure | 499 | 684 | (27) |
| Depreciation | 579 | 552 | 5 |
| EBITDA | 1 332 | 924 | 44 |
Prices
The average US dollar CIF index price for high-grade manganese ore (43.5%) increased by 2% year on year. The average US dollar CIF index price for low-grade manganese ore (36.5%) decreased by 2% year on year.
Volumes
Manganese ore sales volumes increased by 1% to 4.5 million tonnes (F2024: 4.4 million tonnes). Export sales volumes were 3.7 million tonnes (F2024: 3.7 million tonnes). Local sales volumes were higher at 0.78 million tonnes (F2024: 0.75 million tonnes) due to increased offtake from a local customer.
Production volumes at Black Rock Mine increased by 4% to 3.7 million tonnes (F2024: 3.6 million tonnes), after addressing critical skills shortage and ore quality issues.
Unit costs
Unit cash costs increased by 9% to R954 per tonne (F2024: R879 per tonne), due to inflationary increases, higher labour headcount due to the filling of key production vacancies and a higher volume of run-of-mine tonnes mined, which were partially offset by higher production volumes.
Unit cost of sales, which includes marketing and distribution costs, increased by 4%, mainly due to higher mining costs, increased net realisable value (NRV) adjustments, and higher marketing expenses. These increases were partially offset by lower freight costs as a result of reduced freight rates.
Capital expenditure and projects
Total capital expenditure for the manganese ore operations was R998 million on a 100% basis (F2024: R1 368 million) due to concerted efforts to preserve cash given the low market prices.
Manganese ore operational statistics (100% basis)
| Unit | F2025 | F2024 | % change | |
| Volumes | ||||
| Export sales | 000t | 3 705 | 3 684 | 1 |
| Domestic sales* | 000t | 778 | 748 | 4 |
| Total sales* | 000t | 4 483 | 4 432 | 1 |
| Production | 000t | 3 761 | 3 622 | 4 |
| Unit costs | ||||
| Change in unit cash costs | % | 9 | 20 | |
| Change in unit cost of sales | % | 4 | 6 | |
| Capital expenditure | R million | 998 | 1 368 | (27) |
* Excluding intra-group sales of 65 000 tonnes sold to Cato Ridge Works (F2024: 184 000 tonnes).
Manganese alloy financial information (attributable basis)
| F2025 Rm |
F2024 Rm |
% change |
|
| Sales | 897 | 862 | 4 |
|---|---|---|---|
| Operating profit | (266) | (188) | (41) |
| Contribution to headline earnings | (228) | (103) | (121) |
| Capital expenditure | 7 | 13 | (46) |
| Depreciation | – | – | – |
| EBITDA | (266) | (188) | (41) |
Prices
Average high-carbon ferromanganese index prices increased by 5% and medium-carbon ferromanganese prices increased by 12% year on year.
Volumes
High-carbon ferromanganese production at Sakura (100% basis) decreased to 222 000 tonnes (F2024: 230 000 tonnes) due to management action to match production to lower sales. High-carbon ferromanganese sales (100% basis) declined by 2% to 221 000 tonnes (F2024: 226 000 tonnes) due to lower offtake from customers.
High-carbon ferromanganese production at Cato Ridge Works decreased by 7% to 94 000 tonnes (F2024: 101 000 tonnes) mainly due to stopping production at the end of May 2025.
Medium-carbon ferromanganese production at Cato Ridge Alloys (100% basis) declined by 6% to 48 000 tonnes (F2024: 51 000 tonnes) due to production losses related to stopping production in May 2025, resulting in only 11 months of production.
High-carbon ferromanganese sales at Cato Ridge Works increased by 10% to 34 000 tonnes (F2024: 31 000 tonnes) due to improved manganese alloy market conditions. Medium-carbon ferromanganese sales at Cato Ridge Alloys (100% basis) decreased by 4% to 48 000 tonnes (F2024: 50 000 tonnes) due to weak market demand.
Unit costs
Unit cash costs at Sakura increased by 11% in F2025 mainly due to lower production volumes and higher ore consumption prices.
Unit cash costs at Cato Ridge Works increased by 8% in F2025 mainly due to a reduction in production output volumes, inflationary increases in ore supply costs and other raw material prices, as well as above-inflation increases in power costs.
Medium-carbon ferromanganese unit cash costs at Cato Ridge Alloys increased by 1% in F2025.
Capital expenditure
Capital expenditure at Cato Ridge Works decreased by 49% to R13 million (F2024: R26 million).
Manganese alloy operational statistics (100% basis)
| Unit | F2025 | F2024 | % change | |
| Volumes | ||||
| Cato Ridge Works sales* | 000t | 34 | 31 | 10 |
| Cato Ridge Alloys sales | 000t | 48 | 50 | (4) |
| Sakura sales | 000t | 221 | 226 | (2) |
| Cato Ridge Works production | 000t | 94 | 101 | (7) |
| Cato Ridge Alloys production | 000t | 48 | 51 | (6) |
| Sakura production | 000t | 222 | 230 | (3) |
| Unit costs – Cato Ridge Works | ||||
| Change in unit cash costs | % | 8 | 11 | |
| Change in unit cost of sales | % | 14 | 8 | |
| Unit costs – Cato Ridge Alloys | ||||
| Change in unit cash costs | % | 1 | (1) | |
| Change in unit cost of sales | % | 9 | (3) | |
| Unit costs – Sakura | ||||
| Change in unit cash costs | % | 11 | (12) | |
| Change in unit cost of sales | % | 6 | (14) |
* Excluding intra-group sales of 57 000 tonnes sold to Cato Ridge Alloys (F2024: 61 000 tonnes).
ARM has announced a series of strategic transactions involving its 50% stake in the joint venture, Assmang. These include the permanent closure of the Cato Ridge Works plant, effective 31 August 2025. Assmang will also sell various land, properties and houses in Cato Ridge to Assore S.A. PropCo Proprietary Limited for R453 million, with part of the land designated for community benefit. Additionally, Assmang will dispose of its 54.36% stake in Sakura Ferroalloys to Assore, resulting in a cash distribution of R900 million to ARM.
Please refer to the announcement available on SENS on 30 June 2025 for further details.
The ARM Ferrous operations, held through its 50% investment in Assmang Proprietary Limited (Assmang), comprise the iron ore and manganese divisions. Assore South Africa Proprietary Limited (Assore), ARM’s partner in Assmang, owns the remaining 50%.
Prices
US dollar PGM prices recovered towards the latter part of F2025 compared to prices achieved in F2024. The average F2025 platinum and rhodium prices were up 6% and 14% respectively, however, the average palladium price declined by 8%, when compared to the prior year.
Average US dollar metal prices
| Unit | F2025 | F2024 | % change | |
| Platinum | US$/oz | 993 | 934 | 6 |
|---|---|---|---|---|
| Palladium | US$/oz | 983 | 1 072 | (8) |
| Rhodium | US$/oz | 4 767 | 4 186 | 14 |
| Nickel | US$/t | 15 746 | 18 133 | (13) |
| Copper | US$/t | 9 311 | 8 679 | 7 |
| Cobalt | US$/lb | 12 | 14 | (14) |
| UG2 chrome concentrate (CIF*) | US$/t | 262 | 284 | (8) |
* CIF – cost, insurance and freight.
Average rand metal prices
| Unit | F2025 | F2024 | % change | |
| Average exchange rate | ZAR/US$ | 18.15 | 18.70 | (3) |
|---|---|---|---|---|
| Platinum | ZAR/oz | 18 026 | 17 464 | 3 |
| Palladium | ZAR/oz | 17 851 | 20 049 | (11) |
| Rhodium | ZAR/oz | 86 526 | 78 276 | 11 |
| Nickel | ZAR/t | 285 827 | 339 059 | (16) |
| Copper | ZAR/t | 169 020 | 162 285 | 4 |
| Cobalt | ZAR/lb | 213 | 253 | (16) |
| UG2 chrome concentrate (CIF*) | ZAR/t | 4 747 | 5 317 | (11) |
* CIF – cost, insurance and freight.
Consistent with prior periods, Two Rivers, Modikwa and the Bokoni mines recognised revenue using provisional pricing. The sales price of the concentrate is determined on a provisional basis at the date of sale, with adjustments made to the sales price based on movements in commodity prices up to the date of final pricing.
Any differences between provisional and final pricing after the reporting period result in the next reporting period’s earnings being impacted by mark-to-market adjustments.
The mark-to-market adjustments at Two Rivers, Modikwa and Bokoni were all positively impacted by the increase in commodity prices towards the end of F2025.
Two Rivers Mine mark-to-market adjustments
| F2025 Rm |
F2024 Rm |
|
| Assay adjustment | 241 | (109) |
|---|---|---|
| Fair value adjustment | 126 | (84) |
| Total mark-to-market adjustments | 367 | (193) |
Modikwa Mine mark-to-market adjustments
| F2025 Rm |
F2024 Rm |
|
| Assay adjustment | (14) | |
| Fair value adjustment | 108 | (5) |
| Total mark-to-market adjustments | 108 | (19) |
Bokoni Mine mark-to-market adjustments
| F2025 Rm |
F2024 Rm |
|
| Assay adjustment | (7) | 14 |
|---|---|---|
| Fair value adjustment | 30 | (5) |
| Total mark-to-market adjustments | 23 | 9 |
Volumes
Tonnes milled were 2% lower compared to F2024. The overall grade improved to 3.03g/t (F2024: 3.01g/t). PGM production volumes declined by 1% to 288 502 6E PGM ounces (F2024: 291 408 6E PGM ounces) owing to limited mining flexibility.
Following accelerated development of the UG2 declines as well as a focused effort on redevelopment beyond geological structures, mining flexibility is expected to improve in F2026.
Unit costs
The unit cash cost per 6E PGM ounce increased by 5% to R16 431 (F2024: R15 589), due to marginally lower production, partially offset by cost-saving initiatives.
Capital expenditure and projects
Of the R1 193 million capital expenditure spent at Two Rivers Mine, R267 million (22%) was spent on the Merensky project before being placed on care and maintenance. Capital expenditure on mining development amounted to R283 million (24%) and infrastructure-related capital expenditure amounted to R258 million (22%).
Merensky project
A decision was made to place the Merensky project on care and maintenance from July 2024, driven by depressed commodity prices in the PGM market. The construction of the Merensky concentrator plant and the first two mining levels have been completed.
Long-term prospects for the Merensky project remain robust and accretive to Two Rivers Mine, and the timing of the recommissioning of the Merensky project is being evaluated.
Two Rivers Mine operational statistics (100% basis)
| Unit | F2025 | F2024 | % change | |
| Cash operating profit | R million | 1 083 | 1 147 | (6) |
|---|---|---|---|---|
| – PGMs | R million | 766 | 797 | (4) |
| – Chrome | R million | 317 | 350 | (9) |
| Tonnes milled | Mt | 3.48 | 3.54 | (2) |
| Head grade | g/t, 6E | 3.03 | 3.01 | 1 |
| PGMs in concentrate | Ounces, 6E | 288 502 | 291 408 | (1) |
| Chrome in concentrate sold | Tonnes | 153 507 | 147 904 | 4 |
| Average basket price | ZAR/kg, 6E | 780 569 | 765 977 | 2 |
| Average basket price | US$/oz, 6E | 1 337 | 1 274 | 5 |
| Cash operating margin | % | 17 | 18 | |
| Cash cost | ZAR/kg, 6E | 528 264 | 501 201 | 5 |
| Cash cost | R/tonne | 1 360 | 1 282 | 6 |
| Cash cost | ZAR/Pt oz | 35 645 | 33 007 | 8 |
| Cash cost | ZAR/oz, 6E | 16 431 | 15 589 | 5 |
| Cash cost | US$/oz, 6E | 905 | 834 | 9 |
Volumes
Production at Modikwa in H1 F2025 was negatively impacted by safety stoppages related to a fatality that occurred in November 2024, as well as excessive rain delaying opencast operations during December 2024. Production increased in H2 F2025, resulting in overall F2025 tonnes milled increasing by 1% when compared to F2024.
The concentrator plant recovery decreased due to a higher ratio of open-pit UG2 ore being milled in the concentrator. PGM ounce production decreased by 3% to 281 638 6E PGM ounces (F2024: 289 751 6E PGM ounces).
Unit costs
Unit cash costs were up 3% to R19 399 per 6E PGM ounce (F2024: R18 837 per 6E PGM ounce), mainly due to the marginally lower PGM ounce production, partially offset by cost-saving initiatives.
Capital expenditure and projects
Capital expenditure at Modikwa Mine (100% basis) reduced by 47% to R444 million (F2024: R834 million). Of this, R79 million (18%) related to fleet refurbishment and critical spares, R93 million (21%) to capital development and R118 million (27%) related to infrastructure capital expenditure.
North shaft project
The downcast ventilation project was initiated to provide additional ventilation for mining levels below 10 level. The projected completion date is expected in Q2 F2026.
South 2 shaft project
The underground-to-surface conveyor belt that connects South 2 infrastructure to South 1 shaft is 85% complete. Due to operational complexities and site preparation delays, the current forecast completion date is Q1 F2026.
Merensky project
The Merensky mining project is producing an average of 50 000 tonnes per month and is contributing positively to the overall fixed costs of the mine.
Modikwa Mine operational statistics (100% basis)
| Unit | F2025 | F2024 | % change | |
| Cash operating profit | R million | 211 | 178 | 19 |
|---|---|---|---|---|
| – PGMs | R million | 87 | 32 | 172 |
| – Chrome | R million | 124 | 147 | (16) |
| Tonnes milled | Mt | 2.43 | 2.40 | 1 |
| Head grade | g/t 6E | 4.48 | 4.46 | – |
| PGMs in concentrate | 6E oz | 281 638 | 289 751 | (3) |
| Chrome in concentrate sold | Tonnes | 98 818 | 85 575 | 15 |
| Average basket price | ZAR/kg 6E | 778 192 | 771 434 | 1 |
| Average basket price | US$/oz 6E | 1 333 | 1 283 | 4 |
| Cash operating margin | % | 4 | 3 | |
| Cash cost | ZAR/kg 6E | 623 679 | 605 613 | 3 |
| Cash cost | ZAR/tonne | 2 246 | 2 270 | (1) |
| Cash cost | ZAR/Pt oz | 45 428 | 45 609 | – |
| Cash cost | ZAR/oz 6E | 19 399 | 18 837 | 3 |
| Cash cost | US$/oz 6E | 1 069 | 1 007 | 6 |
Update
The acquisition of Bokoni was underpinned by its superior Mineral Resources, both in grade and size, presenting a clear long-term value creation opportunity. ARM’s investment thesis envisages a large-scale mechanised mining operation, designed to unlock economies of scale and deliver competitive rand-per-tonne operating costs. The strategy is focused on UG2 Reef, which not only carries a Mineral Resource grade 30% higher than the Merensky, but also benefits from lower geological losses.
In 2023, the early ounces project was approved as an initial step toward the larger 240ktpm mine development. The project was designed to unlock early value by leveraging existing infrastructure – including the 60ktpm UG2 concentrator plant and underground infrastructure at Middelpunt Hill Decline – while advancing mechanised UG2 development and mining conventional stopes that had remained unmined when the mine was placed on care and maintenance. Importantly, the early ounces project was always envisaged as a strategic precursor and enabler of the long-term growth strategy, rather than a standalone business.
As market conditions evolved, with weaker PGM prices and an uncertain outlook, ARM made the disciplined decision to defer the 240ktpm growth project. Without this larger scale, the lower production volumes obtained from the early ounces project could not achieve the required economies of scale. As a result, ore mining and milling operations were suspended at the end of F2025, enabling Bokoni to refocus capital and strategic efforts on ore reserve development to support sustainable future production.
Looking ahead, Bokoni’s future lies in a higher-grade, smaller-scale development path. By revising the mining method, we aim to maximise ore grade and revenue per tonne, while maintaining capital efficiency. The revised plan targets an initial 120ktpm operation, with phased expansion to 240ktpm.
A feasibility study for the 120ktpm development is currently underway and is expected to be completed in early 2026, after which an investment decision will be made. We remain confident that this disciplined, high-grade strategy is the right approach to unlock the full value of Bokoni’s world-class Mineral Resource, positioning the mine for sustainable returns over the long term.
Capital expenditure
Of the R563 million spent at Bokoni, R120 million related to mine development, R122 million was spent on the Klipgat portal development, and R80 million on the early ounce project. R54 million was spent on the chrome recovery plant, R36 million on surface infrastructure, R16 million on open-pit mining and R22 million on the implementation of an enterprise resource planning (ERP) system.
Bokoni Mine operational statistics (100% basis)
| Unit | F2025 | F2024 | % change | |
| Cash operating loss | R million | (868) | (169) | >(200) |
|---|---|---|---|---|
| Tonnes milled | Mt | 0.52 | 0.33 | 58 |
| Head grade | g/t 6E | 4.42 | 3.82 | 16 |
| PGMs in concentrate | 6E oz | 45 579 | 28 199 | 62 |
| Average basket price | ZAR/kg 6E | 778 541 | 786 673 | (1) |
| Average basket price | US$/oz 6E | 1 334 | 1 309 | 2 |
| Cash operating margin | % | (105) | (31) | |
| Cash cost | ZAR/kg 6E | 1 197 070 | 835 179 | 43 |
| Cash cost | ZAR/tonne | 3 262 | 2 243 | 45 |
| Cash cost | ZAR/Pt oz | 97 605 | 69 160 | 41 |
| Cash cost | ZAR/oz 6E | 37 233 | 25 977 | 43 |
| Cash cost | US$/oz 6E | 2 051 | 1 389 | 48 |
Nkomati Mine has been on care and maintenance since F2021.
ARM and Norilsk Nickel Africa Proprietary Limited concluded a sale agreement that provides for the acquisition by ARM of Norilsk Nickel Africa’s 50% participation interest in Nkomati Mine for cash of R1 million (the transaction). All conditions precedent have been met, and the acquisition has been successfully closed in July 2025.
Nkomati is South Africa’s only proven primary nickel resource. Its sulphide poly metallic reserve base and established infrastructure provide several relatively low capital intensity value-enhancing options for ARM which are being concurrently considered. ARM is in the process of recommissioning the chrome washing plant for the processing of existing stockpiles. The early revenue from the chrome production will reduce the costs associated with care and maintenance whilst ARM is evaluating its options.
At 30 June 2025, the estimated undiscounted rehabilitation costs attributable to ARM were determined to be R1 151 million (30 June 2024: R1 191 million) excluding VAT. The decrease in the undiscounted liability is attributed mainly to expenditure incurred in F2025 on the construction of the water treatment plant. The discounted rehabilitation costs attributable to ARM were determined to be R1 061 million (30 June 2024: R1 119 million).
At 30 June 2025, R363 million (attributable to ARM) in cash and financial assets was available to fund rehabilitation obligations for Nkomati Mine. The resulting attributable shortfall in discounted rehabilitation costs of R1 760 million is expected to be funded by ARM.
Nkomati Mine’s estimated rehabilitation costs continue to be reassessed as engineering designs evolve and new information becomes available. Refer to note 22 in the condensed group financial statements.
Prices
GGV’s average received export price declined by 8% to US$82/tonne (F2024: US$89/tonne). PCB’s average received export price declined by 12% to US$75/tonne (F2024: US$85/tonne).
Coal prices weakened in H2 F2025, owing to lower demand from China and India, driven by weaker growth in electricity consumption and strong increases in power generation from renewable sources. Thermal coal demand continued to decline in European markets due to an increase in nuclear and renewable energy generation. Overall global demand was impacted by geopolitical tensions and economic policy.
Contrastingly, in H2 F2025, coal demand grew in the United States as robust growth in electricity demand combined with higher gas prices drove up coal consumption for power generation.
Approximately 75% and 70% of export volumes at GGV Mine and PCB comprised high-quality coal, respectively.
GGV attributable headline earnings analysis
| F2025 Rm |
F2024 Rm |
% change |
|
| Cash operating profit | 453 | 680 | (33) |
|---|---|---|---|
| Amortisation and depreciation | (264) | (199) | (33) |
| Net finance (cost)/income | (31) | 6 | >(200) |
| (Loss)/profit on sale of assets | (1) | 1 | (200) |
| Loan remeasurement and fair value losses | (16) | (20) | 20 |
| Profit before taxation | 141 | 468 | (70) |
| Add: Loss/(profit) on sale of assets | 1 | (1) | 200 |
| Less: Taxation | (8) | (136) | 94 |
| Headline earnings attributable to ARM | 134 | 331 | (60) |
Volumes
Due to the decrease in the coal price, trucking to other ports was significantly reduced in F2025 resulting in a reduction in export sales volumes. ARM attributable saleable production decreased by 7% to 1.74 million tonnes (F2024: 1.87 million tonnes).
Unit costs
On-mine unit production costs per saleable tonne increased by 14% to R634 per tonne (F2024: R555 per tonne) as a direct result of the reduced saleable production. Furthermore, unit costs in the current year were negatively impacted by decreased capitalisation of box cuts.
Capital expenditure
Capital expenditure increased by 36% to R1 057 million (F2024: R777 million), largely due to increased spend on mobile equipment replacements based on normal operating lifecycle requirements.
GGV operational statistics
| Unit | F2025 | F2024 | % change | |
| Total production and sales (100% basis) | ||||
| Saleable production | Mt | 6.71 | 7.18 | (7) |
| Export thermal coal sales | Mt | 3.61 | 4.15 | (13) |
| Domestic thermal coal sales | Mt | 3.06 | 3.14 | (3) |
| ARM attributable production and sales | ||||
| Saleable production | Mt | 1.74 | 1.87 | (7) |
| Export thermal coal sales | Mt | 0.94 | 1.08 | (13) |
| Domestic thermal coal sales | Mt | 0.80 | 0.82 | (2) |
| Average received coal price | ||||
| Export (FOB)* | US$/t | 81.89 | 88.65 | (8) |
| Domestic (FOT)** | ZAR/t | 422 | 402 | 5 |
| Unit costs | ||||
| On-mine saleable cost | ZAR/t | 634 | 555 | 14 |
| Capital expenditure | R million | 1 057 | 777 | 36 |
* FOB – free-on-board.
** FOT – free-on-truck.
PCB attributable headline earnings analysis
| F2025 Rm |
F2024 Rm |
% change |
|
| Cash operating profit | 407 | 688 | (41) |
|---|---|---|---|
| Amortisation and depreciation | (527) | (606) | 13 |
| Profit before taxation | (120) | 82 | >(200) |
| Less: Taxation | 33 | (22) | >200 |
| Headline earnings attributable to ARM | (87) | 60 | >(200) |
Volumes
Similar to GGV, due to the decrease in the coal price, trucking to other ports was significantly reduced in F2025, resulting in a reduction in export sales volumes.
Export sales volumes at PCB operations were 7% lower at 8.0 million tonnes (F2024: 8.6 million tonnes). Domestic sales volumes declined by 27% to 1.19 million tonnes (F2024: 1.63 million tonnes) largely due to decreased coal sales to Eskom.
ARM attributable saleable production decreased by 9% to 1.89 million tonnes in F2025 (F2024: 2.07 million tonnes).
Unit costs
Unit production costs per saleable tonne increased by 5% to R849 per tonne (F2024: R807 per tonne) as cost-saving initiatives reduced the impact of inflationary cost increases.
PCB operational statistics
| Unit | F2025 | F2024 | % change | |
| Total production sales (100% basis) | ||||
| Saleable production | Mt | 9.36 | 10.27 | (9) |
| Export thermal coal sales | Mt | 7.96 | 8.58 | (7) |
| Domestic thermal coal sales | Mt | 1.19 | 1.63 | (27) |
| ARM attributable production and sales | ||||
| Saleable production | Mt | 1.89 | 2.07 | (9) |
| Export thermal coal sales | Mt | 1.61 | 1.73 | (7) |
| Domestic thermal coal sales | Mt | 0.24 | 0.33 | (27) |
| Average received coal price | ||||
| Export (FOB)* | US$/t | 75.49 | 85.09 | (11) |
| Domestic (FOT)** | ZAR/t | 762 | 701 | 9 |
| Unit costs | ||||
| On-mine saleable cost | ZAR/t | 849 | 807 | 5 |
| Capital expenditure | R million | 2 165 | 2 127 | 2 |
* FOB – free-on-board.
** FOT – free-on-truck.
ARM’s economic interest in PCB is 20.2%. PCB consists of two large mining complexes in Mpumalanga. ARM has a 26% effective interest in the GGV Mine near Ogies in Mpumalanga.
ARM’s investment in Harmony was positively revalued by R5 731 million in F2025 (F2024: R6 630 million) as the Harmony share price increased by 46% from R168.05 at 30 June 2024 to R244.81 at 30 June 2025. The Harmony investment is therefore reflected on the ARM statement of financial position at R18 279 million (F2024: R12 548 million) based on its share price.
Gains and losses are accounted for, net of deferred capital gains tax, through the statement of comprehensive income. Dividends from Harmony are recognised in the ARM statement of profit or loss on the last day of registration following dividend declaration.
ARM implemented a hedging collar transaction involving 18 million shares in Harmony Gold, representing 24% of its equity in Harmony. The collar and related arrangements provide ARM with access to funding in the future on efficient terms while retaining partial upside exposure. The structure includes a put option at R234.85 and a call option at R562.40, both maturing in June 2030.
ARM remains fully committed to Harmony as a strategic investment and remains confident in Harmony and its management’s ability to drive growth and value for its shareholders.
Please refer to the announcement available on SENS on 11 June 2025 for further details.
Harmony headline earnings per share increased by 26% to 2 337 cents per share (F2024: 1 852 cents per share).
Net profit increased by 67% to R14 548 million (F2024: R8 688 million).
Harmony’s results for the year ended 30 June 2025 can be found on its website: www.harmony.co.za.
Global economic growth is projected to improve slightly for the remainder of 2025 and is projected to reach 3.1% in 2026, according to the International Monetary Fund (IMF). Softer inflation and improved financial conditions are helping to stabilise the growth momentum, but recovery is uneven across countries. Advanced economies are growing slowly owing to the lingering effects of tight monetary policy, while many emerging markets are constrained by debt burdens and weak investment. There are significant downside risks, including the possibility that effective tariff rates could rebound, which would lead to weaker growth. Elevated uncertainty and geopolitical tensions could also weigh on economic activity and disrupt global supply chains.
South Africa’s economic outlook is characterised by a mix of modest growth, persistent challenges and significant risks. The 2025 GDP growth forecast has been revised downwards to around 0.9%, largely attributable to ongoing issues with freight capacity and infrastructure. The South African Reserve Bank has been cautious with its monetary policy, making limited interest rate cuts despite a decline in inflation. The country faces various risks, including the potential for a rebound in US tariffs, which could negatively impact trade and growth, and exacerbate the already high unemployment rate. Nonetheless, positive developments, such as the implementation of structural reforms, have the potential to boost business and investor confidence and improve export capacity in the future.
There has been a positive shift in market sentiment for steel, driven by the new hydropower project in China and the expectation of increased government spending to support economic growth. However, this optimism is tempered by the anticipation of cuts in China’s steel production later in the year. China’s iron ore imports are expected to decrease slightly this year but are anticipated to recover over the next few years. In the medium term, the Simandou Mine in Guinea is projected to significantly increase global supply, which will likely lead to a decline in iron ore prices.
The PGM market has seen strong sales in the first half of the year, especially in China and North America. The imposition of US tariffs poses a risk to PGM prices for the remainder of the year, however, this could be partially mitigated by a renewed interest in internal combustion engines in the US market.
The coal market has shifted from the tight market conditions of 2022 to being in oversupply in 2025, driven by weaker oil and gas demand, increased nuclear restarts in Japan, renewable energy growth in Asia and strong Chinese exports. This has led to higher inventories and falling prices. A material rebound in prices is not expected before 2027. The thermal coal market is likely to remain under pressure, with prices expected to hover near the bottom of the seaborne cost curve as market fundamentals offer minimal signs of a short-term recovery.
The manganese ore market has shifted from a period of tight supply and high prices to one of oversupply and weak demand. Supply disruptions and strong demand drove prices up, but by late March 2024, increased shipments, a build-up in inventory, and a slowdown in steel and alloy demand, especially from China’s struggling construction sector, led to a sharp decline in prices. Market sentiment remains bearish, with production cuts and potential stimulus measures in China seen as key to rebalancing supply and restoring price stability.
Despite the ongoing commodity market volatility, ARM remains optimistic about the medium to long-term outlook for the mining sector. Encouraging signs of recovery in key markets, improving financial conditions, and infrastructure investment reinforce our view. With a portfolio of quality, long-life assets and world-class ore bodies, ARM is well-positioned to navigate the uncertain commodity and market environment. We continue to strengthen resilience by driving productivity, improving cost efficiency and optimising capital allocation. Our disciplined approach, including value-accretive corporate actions such as the Harmony hedge, share buyback, and disposal of the Cato Ridge complex, demonstrates our commitment to creating sustainable value for our shareholders and all stakeholders.
ARM aims to pay ordinary dividends to shareholders in line with our dividend guiding principles. Dividends are at the discretion of the board of directors, which considers the company’s capital allocation guiding principles and other relevant factors such as financial performance, commodities outlook, investment opportunities, gearing levels, as well as solvency and liquidity requirements of the Companies Act.
For F2025, the board approved and declared a final dividend of 600 cents per share (gross) (F2024: 900 cents per share). The amount to be paid is approximately R1 252 million.
The dividend declared will be subject to dividend withholding tax. In line with paragraphs 11.17(a)(i) to (x) and 11.17(c) of the JSE Listings Requirements, the following additional information is disclosed:
A gross dividend of 600 cents per ordinary share, being the dividend for the year ended 30 June 2025, has been declared payable on Monday, 6 October 2025 to those shareholders recorded in the books of the company at the close of business on Friday, 3 October 2025. The dividend is declared in the South African currency. Any change in address or dividend instruction applying to this dividend must be received by the company’s transfer secretaries or registrar no later than Friday, 3 October 2025. The last day to trade ordinary shares cum dividend is Tuesday, 30 September 2025. Ordinary shares trade ex-dividend from Wednesday, 1 October 2025. The record date is Friday, 3 October 2025, while the payment date is Monday, 6 October 2025.
No dematerialisation or rematerialisation of share certificates may occur between Wednesday, 1 October 2025 and Friday, 3 October 2025, both dates inclusive, nor may any transfers between registers take place during this period.
There has been no material change to ARM’s Mineral Resources and Mineral Reserves as disclosed in the integrated annual report for the financial year ended 30 June 2025, apart from:
No Mineral Reserves are reported for Beeshoek. The operation is in the process of transitioning to care and maintenance due to the absence of a supply agreement under prevailing market constraints, which currently limit the ability to support sustained mining. Previously reported Mineral Reserves have been reclassified as Mineral Resources.
No Mineral Reserves are reported for Bokoni. The feasibility study is being reviewed and refined based on insights gained from the recent early ounces project. The operation is shifting its focus to strategically de-risking the project, while continuing key capital development in support of a phased approach.
An updated Mineral Resources and Mineral Reserves statement will be issued in our 2025 integrated annual report.
As announced on the JSE SENS, the following changes to the board have taken place during F2025:
Signed on behalf of the board:
PT Motsepe
Executive chairman
VP Tobias
Chief executive officer
Johannesburg
5 September 2025
We have reviewed the accompanying condensed group statement of financial position of African Rainbow Minerals Limited (“the Group”) at 30 June 2025, the condensed group statements of profit or loss, comprehensive income, changes in equity and cash flows for the year then ended, and notes to the condensed group financial statements (“the condensed group financial statements”).
The directors are responsible for the preparation and presentation of these condensed group financial statements in accordance with IAS 34, Interim Financial Reporting. Our responsibility is to express a conclusion on these condensed group financial statements based on our review.
We conducted our review in accordance with the International Standard on Review Engagements 2410, “Review of Interim Financial Information Performed by the Independent Auditor of the Entity”. A review of condensed group financial statements consists of making inquiries, primarily of persons responsible for financial and accounting matters, and applying analytical and other review procedures. A review is substantially less in scope than an audit conducted in accordance with International Standards on Auditing and consequently does not enable us to obtain assurance that we would become aware of all significant matters that might be identified in an audit. Accordingly, we do not express an audit opinion.
Based on our review, nothing has come to our attention that causes us to believe that the accompanying condensed group financial statements at 30 June 2025 is not prepared, in all material respects, in accordance with IAS 34, Interim Financial Reporting.
KPMG Inc.
Registered Auditor
Per S Loonat
Chartered Accountant (SA)
Registered Auditor
Director
5 September 2024
85 Empire Road
Parktown
2193