We are committed to maintaining a safe and healthy work environment for all employees and contractors.
Our operations delivered improved safety performance. The group LTIFR per 200 000 man-hours improved to 0.27 (F2022: 0.31), while the TRIFR1 improved to 0.62 (F2022: 0.69).
Regrettably, there was a fatality at Two Rivers Mine when a contractor employee, Mr Seutlwadi Esron Ramathesela, an engineering assistant, was injured and later succumbed to his injuries. We extend our sincere condolences to his family, friends and colleagues.
Independent root cause investigations were done and action plans were implemented and closed out. We continue to work towards ensuring zero harm at our operations.
The World Health Organization (WHO) declared that Covid-19 is no longer a public health emergency of international concern. The South African Department of Health eased all Covid-19 regulations and protocols, but ARM operations continue with Covid-19 management as dictated by the outcomes of the risk assessments.
Decarbonisation and journey to net-zero
In F2021, ARM set a long-term target of achieving net-zero greenhouse gas (GHG) emissions (scope 1 and 2) from mining by 2050. Building on this, in F2022 and F2023, we focused on developing decarbonisation pathways that detail the short and medium-term steps needed to achieve this long-term target. We will be focusing on ways to implement these pathways, including allocating capital to renewable energy and other measures, developing executive incentives to drive operational action, and developing data systems to improve the quality and efficiency of our reporting.
1 TRIFR includes the number of fatal injuries, number of lost-time injuries and number of medical treatment cases.
Increasing access to and use of renewable energy
At ARM Platinum mining operations, specific options were explored to wheel renewable power supply. In April 2023, a 20-year power purchase agreement (PPA) was concluded with SOLA Group and financial close was reached for wheeling 100MW of solar photovoltaic (PV) power to ARM Platinum's mining operations, namely Two Rivers, Bokoni and Nkomati mines. This PPA is expected to generate circa 4 900 000MWh of renewable electricity and save circa 4 800 000tCO2e over 20 years. Construction of the solar PV facility commenced in July 2023. Electrical energy from the facility is expected to commence supply to ARM Platinum's mining operations in F2026.
Eskom is currently building a new 132kV transmission line to meet increased electricity requirements associated with the Two Rivers Merensky Project. Construction completion and commissioning are planned for F2024 in time for the new Merensky concentrator plant's power requirements. This investment in network infrastructure would further contribute to the potential for wheeling renewable power to the mine.
At ARM Ferrous mining operations, a feasibility study commissioned in 2021 exploring experienced performance challenges and the contract has been terminated. The Northern Cape mines are now progressing with a prefeasibility study to explore the correct energy mix for the mines that will cater to the baseload demand. The study will also explore the best option between outright ownership versus sourcing power from independent power producers.
Water management
Water supply to Khumani Mine remains a risk since phase 2 of the refurbishment of the Vaal Gamagara Pipeline has not yet started, resulting in more down-time and higher operating and maintenance costs of the pipeline.
This challenge impacts other mines in the Northern Cape and communities as well. Therefore, Assmang in partnership with the mines in the area are engaging with Vaal Central Water Board (VCWB) and the Department of Water and Sanitation and its officials to mitigate the risk by expediting the refurbishment project and supporting VCWB with financial assistance for the day-to-day operations and maintenance of the pipeline.
Assmang operations have successfully implemented measures to supplement water supply from neighbouring mines' stormwater since February 2023. This arrangement has worked well but is unfortunately not sustainable and currently Khumani Mine is again reliant on all its water from VCWB. The long-term solution is the refurbishment of the Vaal Gamagara Pipeline, which is being addressed as a key priority between the department and the Northern Cape mines.
Tailings management
ARM, as a member of the International Council on Mining and Metals (ICMM), published its progress towards conformance with the Global Industry Standard on Tailings Management (GISTM) on 5 August 2023. The report was published on the company website at www.arm.co.za and is available on the following link: https://arm.co.za/wp-content/uploads/2023/08/ARM-GISTM-Report-2023-1.pdf
Despite lower commodity prices for our key commodities, including iron ore and platinum group metals (PGMs), we maintained our robust financial position with net cash of R9 779 million at 30 June 2023 (F2022: R11 175 million). This gives ARM the flexibility to opportunistically pursue value-enhancing growth prospects.
In F2023, total value created was R21 240 million (F2022: R27 489 million) on a segmental basis which was distributed to stakeholders and reinvested in our business as shown below.
| R million | F2023 | F2022 |
| Salaries and fringe benefits to employees | 4 893 | 4 214 |
|---|---|---|
| Taxes to government | 4 541 | 6 545 |
| Income tax | 3 469 | 4 817 |
| Royalty tax | 1 072 | 1 728 |
| Finance costs, dividends and non-controlling interest to capital providers | 8 239 | 8 532 |
| Dividends | 6 666 | 6 270 |
| Non-controlling interest | 1 242 | 1 938 |
| Finance costs | 331 | 324 |
| Total value distributed | 17 673 | 19 291 |
| Reinvested in the group | 3 567 | 8 198 |
| Amortisation | 2 155 | 2 042 |
| Reserves retained | 1 412 | 6 156 |
| Total value | 21 240 | 27 489 |
We are pleased to have declared a dividend of R102 million (F2022: R255 million) to communities who have an effective 8.5% shareholding in Modikwa Mine. These dividends will be invested in projects that will benefit the communities neighbouring Modikwa Mine.
Headline earnings for F2023 decreased by 21% to R8 981 million or R45.81 per share (F2022: R11 338 million or R57.87 per share). The F2022 headline earnings included re-measurement losses of R808 million mainly related to the ARM Coal Loans owing to Glencore Operations South Africa. These loans have since been fully settled.
The average realised rand weakened by 17% versus the US dollar to R17.76/US$ compared to R15.21/US$ in F2022. For reporting purposes, the closing exchange rate was R18.90/US$ (30 June 2022: R16.38/US$).
| R million | F2023 | F2022 | % change |
| ARM Ferrous | 5 528 | 6 682 | (17) |
|---|---|---|---|
| Iron ore division | 4 158 | 4 654 | (11) |
| Manganese division | 1 372 | 2 068 | (34) |
| Consolidation adjustment | (2) | (40) | 95 |
| ARM Platinum | 1 465 | 3 066 | (52) |
| Two Rivers Mine | 1 262 | 1 968 | (36) |
| Modikwa Mine | 819 | 1 270 | (36) |
| Bokoni Mine | (406) | – | – |
| Nkomati Mine | (210) | (172) | (22) |
| ARM Coal | 1 535 | 928 | 65 |
| Goedgevonden Mine | 540 | (5) | |
| PCB operations* | 995 | 933 | 7 |
| ARM Corporate and other | 453 | 662 | (32) |
| Corporate and other (including Gold) | 649 | 826 | (21) |
| Machadodorp Works | (196) | (164) | (20) |
| Headline earnings | 8 981 | 11 338 | (21) |
* PCB refers to Participative Coal Business.
ARM Ferrous headline earnings were 17% lower at R5 528 million (F2022: R6 682 million), driven by a 34% decrease in headline earnings in the manganese division and an 11% decrease in the iron ore division.
Lower headline earnings in the iron ore division were driven by a decrease in the average realised US dollar iron ore prices and lower export sales volumes, partially offset by the weaker rand versus US dollar exchange rate and lower freight costs.
Iron ore headline earnings include a R279 million (pre-tax) negative fair value adjustment on iron ore sales (F2022: R618 million negative adjustment), of which 66% is based on confirmed prices and 34% is based on forward prices. Refer to below for further information on the mark-to-market adjustments in ARM Ferrous.
Lower headline earnings in the manganese division were driven by a decrease in the average realised US dollar manganese ore and alloy prices and higher production and railage costs, which were partially offset by the weaker rand versus US dollar exchange rate and lower freight costs.
ARM Platinum headline earnings decreased by 52% to R1 465 million (F2022: R3 066 million).
Two Rivers Mine headline earnings reduced to R1 262 million (F2022: R1 968 million), mainly due to negative mark-to-market adjustments of R1 065 million (F2022: R709 million negative adjustment) and a 24% increase in unit cash costs (on a rand per 6E PGM ounce basis) which is as result of above inflationary pressures on costs. Challenges with grade persisted at the mine, the head grade reduced to 3.00g/t compared to 3.22g/t last year.
Modikwa Mine reported a 36% decline in headline earnings to R819 million (F2022: R1 270 million), which included negative mark-to-market adjustments of R253 million (F2022: R231 million). The mine's production volumes decreased by 3% while unit cash costs (on a rand per 6E PGM ounce basis) were up by 21% due to above inflationary pressures on costs.
For more detail and a table showing the mark-to-market adjustments at Two Rivers and Modikwa mines, refer to below of this report.
Bokoni Mine, which is included for the first time in the ARM annual results, reported a headline loss of R406 million for F2023. The early ounce project, approved in March 2023, is on track and the first PGM ounce production is expected in the second quarter of F2024.
Nkomati Mine reported a headline loss of R210 million (F2022: R172 million). The mine was placed on care and maintenance on 15 March 2021. ARM and its joint venture partner are considering various options for the future of Nkomati Mine.
ARM Coal reported headline earnings of R1 535 million (F2022: R928 million) driven mainly by a reduction in re-measurement losses of R1 252 million which resulted from accelerated repayment of the loans owing to shareholders.
GGV Mine's headline earnings were R540 million (F2022: R5 million loss). PCB headline earnings were R995 million (F2022: R933 million).
Refer to below for a detailed analysis of the GGV and PCB operational profit performance. No re-measurement losses were included in PCB headline earnings.
ARM Corporate and other (including Gold) reported headline earnings of R649 million (F2022: R826 million). Included in ARM Corporate and other are re-measurement gains of R12 million (F2022: R448 million).
Machadodorp Works headline loss of R196 million (F2022: R164 million) related to research into developing energy-efficient smelting technology.
Basic earnings of R8 078 million (F2022: R12 426 million) included attributable impairments as follows:
Refer to note 4 of the condensed group financial statements for further details on these impairments.
At 30 June 2023, ARM had net cash of R9 779 million (30 June 2022: R11 175 million), a decrease of R1 396 million compared to the end of the 2022 financial year. This amount excludes attributable cash and cash equivalents held at ARM Ferrous (50% of Assmang) of R4 939 million (30 June 2022: R5 342 million).
| R million | F2023 | F2022 |
| Assmang | 5 000 | 5 500 |
|---|---|---|
| Modikwa Mine* | – | 1 000 |
| Participative Coal Business (PCB)** | 598 | – |
| Two Rivers Mine | 486 | 1 245 |
| Harmony Gold | 17 | 50 |
| Total dividends received | 6 101 | 7 795 |
| * | Modikwa paid distributions of R875 million to ARM Mining Consortium (ARM MC), which in turn paid R500 million to ARM Platinum during F2023. ARM MC is owned 83% by ARM Platinum and holds 50% of Modikwa Mine. |
| ** | PCB paid a R598 million dividend to ARM Corporate for its 10% direct investment in PCB. PCB also paid a R1 196 million (R610 million attributable to ARM) dividend to ARM Coal for its 20% investment. |
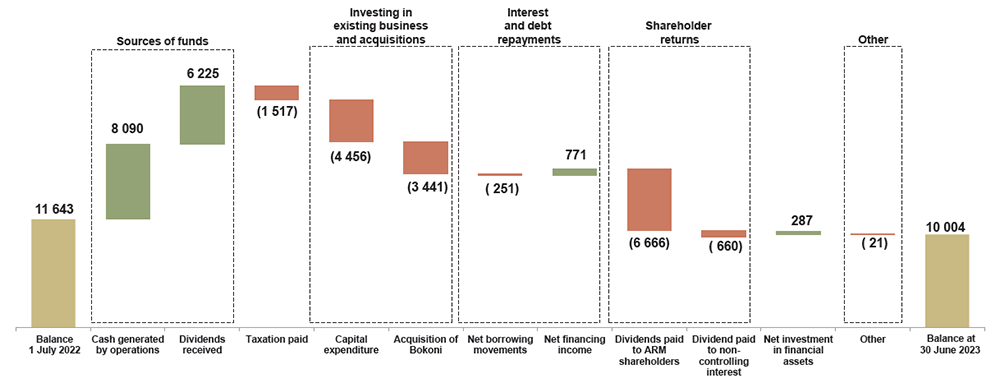
Cash generated from operations decreased by R418 million to R8 090 million (F2022: R8 508 million) after an inflow in working capital of R1 212 million (F2022: R1 640 million outflow), which was mainly due to an inflow in trade receivables.
In F2023, ARM paid R6 666 million in dividends to its shareholders, representing the interim dividend of R14.00 and the final dividend of R20.00 per share declared for F2022 (F2022: R6 270 million representing the interim dividend of R12.00 and the F2021 final dividend of R20.00 per share).
Net cash outflow from investing activities was R7 511 million (F2022: R2 492 million) and included the net cash payment for the acquisition of Bokoni Mine of R3 441 million (which represents the gross cash payment of R3 500 million, net of R59 million cash acquired in the transaction).
Borrowings of R251 million (F2022: R109 million) were repaid during the period, resulting in gross debt of R242 million at 30 June 2023 (30 June 2022: R484 million).
ARM continues to be confident about the long-term profitability of Bokoni. Good progress has been made in advancing the DFS, which has been based on a phased development approach to reduce peak funding requirements, optimise production ramp-up and minimise project execution risk. The DFS also preserves the optionality to increase production to an optimal production rate in the future.
The DFS indicates higher capital costs relative to the 2021 investment case due to inflationary cost increases and an enhanced scope definition. The project remains robust and is expected to be attractive in terms of industry cost competitiveness. The DFS will now advance to bankable feasibility and then be presented to the board for approval.
The early ounce project that was approved in March 2023 is progressing well, with the first saleable PGM concentrate expected by December 2023. The early ounce project focuses on a combination of mining high-grade UG2 stopes in the Middelpunt Hill shaft and early on-reef development of the new UG2 mine. Critical orders for long lead items, to de-risk the project schedule, have been placed. The early ounces will enable the mine to commence with early development of the underground infrastructure required for the new planned UG2 mine.
We continued to invest in our existing operations with segmental capital expenditure of R7 201 million for the period (F2022: R4 727 million). The increase in capital expenditure was mainly due to the Merensky Project at Two Rivers Mine. Capital expenditure for the divisions is shown below and discussed in each division's operational performance section below.
| R million | F2023 | F2022 | % change |
| ARM Ferrous | 2 440 | 2 450 | – |
|---|---|---|---|
| Iron ore division | 1 707 | 1 445 | 18 |
| Manganese division | 841 | 1 110 | (24) |
| Consolidation adjustment | (108) | (105) | – |
| ARM Platinum | 4 420 | 2 159 | 104 |
| Two Rivers Mine | 3 167 | 1 806 | 75 |
| Modikwa Mine | 561 | 353 | 59 |
| Bokoni Mine | 692 | – | – |
| ARM Coal (Goedgevonden Mine only) | 331 | 110 | >200 |
| ARM Corporate | 10 | 8 | 25 |
| Total | 7 201 | 4 727 | 52 |
Average realised US dollar export iron ore prices were 13% lower on a free-on-board (FOB) equivalent basis at US$105 per tonne (F2022: US$121 per tonne).
Iron ore prices moderated in the second quarter of the year due to slowing global economic growth and an easing in the rate of recovery of Chinese steel production.
Following a strong rebound in prices to the peak of over US$130 per tonne in March 2023, the benchmark iron ore price fell to around US$105 per tonne at the beginning of July 2023.
The recent price falls reflect lower demand from Chinese mills due to blast furnace maintenance and the introduction of restrictions on steel production in China's leading steel-making centre, Tangshan. Some steel plants reduced capacity by 30% to 50% during July 2023. These measures are taken to improve air quality in the region.
Movements in iron ore prices resulted in the following mark-to-mark adjustments:
| R million | F2023 | F2022 |
| Fair value adjustments realised during the year | (828) | (4 490) |
|---|---|---|
| Revenue – fair value adjustments current period | (456) | (3 532) |
| Revenue – fair value adjustments previous period sales | (372) | (958) |
| Fair value adjustments at interim (unrealised) | (557) | (1 235) |
| Based on confirmed prices | (368) | (555) |
| Based on forward prices | (189) | (681) |
| Total revenue – fair value adjustments | (1 385) | (5 725) |
| Realised fair value adjustments for the period | (828) | (4 490) |
| Unrealised fair value adjustments for the period | (557) | (1 235) |
Total iron ore sales volumes decreased by 12% to 14.2 million tonnes (F2022: 16.1 million tonnes). Export sales volumes were 9% lower at 12.0 million tonnes (F2022: 13.2 million tonnes) due to poor operational logistics performance, including backlog maintenance on the rail network (reduced slot capacity), Transnet strikes, several derailments, and equipment breakdowns in the port.
Local sales volumes decreased by 22% to 2.2 million tonnes (F2022: 2.9 million tonnes). The decrease in local sales volumes is attributable to the lower offtake, due to internal and external constraints experienced by our local customer.
The sales lump-to-fines ratio decreased from 60:40 in F2022 to 56:44 in F2023.
Total iron ore production volumes decreased by 14% to 13.9 million tonnes (F2022:16.2 million tonnes).
Khumani Mine reduced production due to logistical challenges and full stockpiles.
On-mine unit production costs for the iron ore division increased by 15% to R364 per tonne (F2022: R317 per tonne) mainly due to 14% lower production volumes, above-inflation increases in the costs of explosives, diesel and maintenance costs.
Cash cost per tonne for the iron ore division increased by 28% to R482 per tonne (F2022: R375 per tonne) mainly due to lower production volumes, higher production costs (as discussed above).
On-mine unit production costs at Khumani Mine increased by 8% to R344 per tonne (F2022: R319 per tonne) mainly due to lower production volumes, above-inflation increase of explosives, diesel, and consumable maintenance costs.
Khumani Mine's on-mine unit cash costs (which include capitalised waste stripping costs and certain non-cash adjustments but exclude run-of-mine ore stock movements) were 26% higher at R455 per tonne (F2022: R361 per tonne) mainly due to above-inflation increases in the costs of diesel and explosives, as well as higher maintenance costs on King loading equipment.
On-mine unit production costs at Beeshoek Mine increased by 45% mainly due to 19% lower production volumes at 2.5 million tonnes (F2022: 3.1 million tonnes) and above-inflation increases in the costs of diesel, explosives, consumables and maintenance.
Beeshoek Mine's unit cash costs were 39% higher mainly due to higher production costs and a 19% decrease in production volumes.
Unit cost of sales for the iron ore division, which includes marketing and distribution costs, were 9% higher, mainly due to an increase in the on-mine production costs (as discussed above) offset by lower freight costs and lower sales and marketing costs driven by the lower sales volumes during F2023.
Water supply to Khumani Mine remains a risk since phase 2 of the refurbishment of the Vaal Gamagara pipeline has not yet started, resulting in more down-time and higher operating and maintenance costs of the pipeline.
This challenge impacts other mines in the Northern Cape and communities as well. Therefore, Assmang in partnership with the mines in the area are engaging with Vaal Central Water Board (VCWB) and the Department of Water and Sanitation and its officials to mitigate the risk by expediting the refurbishment project and supporting VCWB with financial assistance for the day-to-day operations and maintenance of the pipeline.
Measures have been implemented to supplement water supply from neighbouring mines' stormwater since February 2023. This arrangement has worked well but is unfortunately not sustainable and currently Khumani Mine is again reliant on VCWB for all its water. The long-term solution is the refurbishment of the Vaal Gamagara pipeline, which is being addressed as a key priority between the Department of Water and Sanitation and the Northern Cape mines.
Capital expenditure (100% basis) was R3 414 million (F2022: R2 890 million), which includes capitalised waste stripping costs of R1 362 million (F2022: R1 318 million).
Khumani Mine's capital expenditure (100% basis) increased by 28% to R2 711 million (F2022: R2 117 million) mainly because of higher capitalised waste stripping costs of R952 million (F2022: R806 million) and above-inflation increases in the costs of explosives and diesel. The higher waste stripping costs at Khumani were due to the mining of more capital waste intensive areas.
Beeshoek Mine's capital expenditure (100% basis) decreased by 8% to R703 million (F2022: R773 million) mainly due to decreased capitalised waste stripping costs of R410 million (F2022: R512 million) due to lower production.
| unit | F2023 | F2022 | % change | ||
| Prices | |||||
| Average realised export price* | US$/t | 105 | 121 | (13) | |
| Volumes | |||||
| Export sales | 000t | 11 966 | 13 176 | (9) | |
| Local sales | 000t | 2 244 | 2 888 | (22) | |
| Total sales | 000t | 14 210 | 16 064 | (12) | |
| Production | 000t | 13 886 | 16 201 | (14) | |
| Export sales lump/fines split | % | 56:44 | 60:40 | ||
| Export sales CIF/FOB** split | % | 56:44 | 56:44 | ||
| Unit costs | |||||
| Change in on-mine unit production costs | % | 15 | 12 | ||
| Change in unit cost of sales | % | 9 | 8 | ||
| Capital expenditure | R million | 3 414 | 2 890 | 18 |
* Average realised export iron ore prices on an FOB equivalent basis.
** CIF – cost, insurance and freight; FOB – free-on-board.
| R million | F2023 | F2022 | % change |
| Sales | 6 487 | 6 005 | 8 |
|---|---|---|---|
| Operating profit | 1 362 | 1 363 | – |
| Contribution to headline earnings | 1 065 | 1 051 | 1 |
| Capital expenditure | 809 | 1 067 | (24) |
| Depreciation | 487 | 450 | 8 |
| EBITDA | 1 849 | 1 813 | 2 |
The manganese ore operations realised lower prices during F2023, with the average 44% manganese ore (CIF) and 37% manganese ore (CIF) index prices decreasing by 16% and 13%, respectively.
Manganese ore sales volumes in F2023 increased by 9% to 4.3 million tonnes (F2022: 3.96 million tonnes). Export sales volumes were marginally lower at 3.6 million tonnes (F2022: 3.7 million tonnes) due to challenges on the export rail capacity from TFR, and local sales volumes were higher at 0.73 million tonnes (F2022: 0.29 million tonnes). In addition, the poor condition of vessels since September 2022 has impacted the export of ore.
Production volumes at Black Rock Mine rose by 3% to 4.3 million tonnes (F2022: 4.1 million tonnes). Completing the Black Rock and Gloria projects has contributed positively to the Black Rock Mine.
On-mine unit production costs and on-mine unit cash costs at the Black Rock Mine increased from R694 per tonne in F2022 to R732 per tonne in F2023 due to above-inflation increases in the costs of explosives, diesel, consumables, maintenance and electricity as well as the significant expenditure towards the operation of emergency generators during load curtailment.
Unit cost of sales (which include marketing and distribution costs) decreased by 4% due to lower freight rates, offset by higher production costs and higher logistics costs as a result of the substitution of lost rail logistics with road freight, as well as increased depreciation due to the Black Rock and Gloria projects having been commissioned.
Total capital expenditure for the manganese ore operations was R 1 618 million on a 100% basis (F2022: R2 133 million), of which R118 million (F2022: R451 million) relates to the Gloria Project.
The Black Rock Project was completed in September 2022 and within the approved budget of R7.4 billion. The Black Rock Project was completed with a 1.4 million fatality-free shifts and a lost-time injury frequency rate (LTIFR) of 0.219.
Gloria Project's Raise Section achieved construction completion in June 2023. Project close-out is underway, and the project is forecasted to be formally closed out within the approved budget of R3 billion.
| unit | F2023 | F2022 | % change | ||
| Volumes | |||||
| Export sales | 000t | 3 589 | 3 666 | (2) | |
| Domestic sales* | 000t | 735 | 291 | 153 | |
| Total sales* | 000t | 4 325 | 3 957 | 9 | |
| Production | 000t | 4 272 | 4 147 | 3 | |
| Unit costs | |||||
| Change in on-mine unit production costs | % | 5 | (1) | ||
| Change in unit cost of sales | % | (4) | 13 | ||
| Capital expenditure | R million | 1 618 | 2 133 | (24) |
* Excluding intra-group sales of 195 000 tonnes sold to Cato Ridge Works (F2022: 168 000 tonnes).
| R million | F2023 | F2022 | % change |
| Sales | 1 158 | 1 359 | (15) |
|---|---|---|---|
| Operating profit | 200 | 392 | (49) |
| Contribution to headline earnings | 307 | 1 017 | (70) |
| Capital expenditure | 32 | 44 | (25) |
| Depreciation | 5 | 5 | – |
| EBITDA | 204 | 397 | (49) |
During F2023, the US dollar index price for high carbon and medium carbon-manganese alloys decreased by 22% and 30% respectively due to weaker market demand exacerbated by the conflict in Ukraine.
High carbon-manganese alloy production at Sakura (100% basis) increased to a record 253 000 tonnes (F2022: 211 000 tonnes). High carbon-manganese alloy sales (100% basis) increased by 23% to 237 000 tonnes (F2022: 192 000 tonnes). Both the production and sales volumes increased significantly from the prior year as Sakura returned to full production capacity during October 2021, after one furnace was left non-operational after multiple transformer failures. High carbon-manganese alloy production at Cato Ridge Works decreased by 3% to 116 000 tonnes (F2022: 119 000 tonnes), mainly due to the switching out of Furnace 1 in February 2023 and Eskom loadshedding.
Medium carbon-manganese alloy production at Cato Ridge Alloys (100% basis) increased by 1% to 56 400 tonnes (F2022: 56 000 tonnes).
High carbon-manganese alloy sales at Cato Ridge Works decreased by 11% to 43 000 tonnes (F2022: 49 000 tonnes) due to the decrease in market demand. Medium carbon-manganese alloy sales at Cato Ridge Alloys (100% basis) increased by 7% to 54 000 tonnes (F2022: 50 000 tonnes). The increase in the medium carbon-manganese alloy sales was mainly attributable to an expansion of the customer base.
Production costs at Sakura increased by 7% in F2023. The increase is mainly due to an increase in realised ore and reductant prices offset by successful cost-saving initiatives implemented to further reduce fixed costs.
Production costs at Cato Ridge Works increased by 15% in F2023. The significant increase is mainly due to a reduction in production volumes, above-inflation increases in power costs, and above-inflation increases in various raw material prices.
Medium carbon-manganese alloy production costs at Cato Ridge Alloys decreased by 6% in F2023, primarily due to the decrease in the price of molten metal.
Capital expenditure for Cato Ridge Works decreased by 25% to R65 million (F2022: R87 million).
| unit | F2023 | F2022 | % change | ||
| Volumes | |||||
| Cato Ridge Works sales* | 000t | 43 | 49 | (12) | |
| Cato Ridge Alloys sales | 000t | 54 | 50 | 8 | |
| Sakura sales | 000t | 237 | 192 | 23 | |
| Cato Ridge Works production | 000t | 116 | 119 | (3) | |
| Cato Ridge Alloys production | 000t | 56 | 56 | – | |
| Sakura production | 000t | 253 | 211 | 21 | |
| Unit costs – Cato Ridge Works | |||||
| Change in unit production costs | % | 15 | 16 | ||
| Change in unit cost of sales | % | 13 | 24 | ||
| Unit costs – Cato Ridge Alloys | |||||
| Change in production unit costs | % | (6) | 57 | ||
| Change in unit cost of sales | % | 9 | 37 | ||
| Unit costs – Sakura | |||||
| Change in unit production costs | % | 7 | 21 | ||
| Change in unit cost of sales | % | 10 | 21 |
* Excluding intra-group sales of 68 000 tonnes sold to Cato Ridge Alloys (F2022: 67 000 tonnes).
The ARM Ferrous operations, held through its 50% investment in Assmang Proprietary Limited (Assmang), comprise the iron ore and manganese divisions. Assore South Africa Proprietary Limited, ARM's partner in Assmang, owns the remaining 50%.
US dollar PGM prices were lower compared to prices achieved in 2022, particularly palladium (20% lower) and rhodium (30% lower). The average rand per 6E kilogramme basket price for Modikwa and Two Rivers declined by 10% and 8% to R1 183 603 per kilogramme (F2022: R1 319 104 per kilogramme) and R1 136 405 per kilogramme (F2022: R1 240 977 per kilogramme), respectively.
| unit | F2023 | F2022 | % change | ||
| Platinum | US$/oz | 970 | 1 003 | (3) | |
|---|---|---|---|---|---|
| Palladium | US$/oz | 1 758 | 2 206 | (20) | |
| Rhodium | US$/oz | 10 811 | 15 543 | (30) | |
| Nickel | US$/t | 23 957 | 23 514 | 2 | |
| Copper | US$/t | 8 289 | 9 644 | (14) | |
| Cobalt | US$/lb | 20 | 32 | (38) | |
| UG2 chrome concentrate – Two Rivers (CIF*) | US$/t | 236 | 184 | 28 | |
| UG2 chrome concentrate – Modikwa (CIF*) | US$/t | 260 | 222 | 17 |
* CIF – cost, insurance and freight.
| unit | F2023 | F2022 | % change | ||
| Average exchange rate | ZAR/US$ | 17.76 | 15.21 | 17 | |
|---|---|---|---|---|---|
| Platinum | ZAR/oz | 17 230 | 15 247 | 13 | |
| Palladium | ZAR/oz | 31 227 | 33 543 | (7) | |
| Rhodium | ZAR/oz | 192 050 | 236 373 | (19) | |
| Nickel | ZAR/t | 425 570 | 357 606 | 19 | |
| Copper | ZAR/t | 147 247 | 146 672 | – | |
| Cobalt | ZAR/lb | 350 | 483 | (28) | |
| UG2 chrome concentrate – Two Rivers (CIF*) | ZAR/t | 4 185 | 2 791 | 50 | |
| UG2 chrome concentrate – Modikwa (CIF*) | ZAR/t | 4 619 | 3 371 | 37 |
* CIF – cost, insurance and freight.
Two Rivers and Modikwa mines recognise revenue using provisional pricing. The sales price of the concentrate is determined on a provisional basis at the date of sale, with adjustments made to the sales price based on movements in the discounted forward commodity prices up to the date of final pricing. Post-refining and delivery, adjustments are made to reflect final pricing.
Any differences between the provisional and final commodity prices after the reporting period result in the next reporting period's earnings being impacted by mark-to-market adjustments.
The sharp decline in platinum, palladium and rhodium prices in the second half of F2023 resulted in realised negative mark-to-market adjustments from the date of provisional recognition to final price realisation as shown in the table below.
Revenue related to open sales at 30 June at Two Rivers and Modikwa mines was initially recognised using provisional prices and subsequently revalued at 30 June per the tables below.
| R million | F2023 | F2022 |
| Realised mark-to-market adjustments | (696) | (505) |
|---|---|---|
| Provisional sales value | 10 313 | 10 696 |
| Final sales value | 9 617 | 10 191 |
| Unrealised mark-to-market adjustments | (369) | (203) |
| Initial provisional sales recognition | 1 260 | 1 967 |
| Period-end provisional sales recognition | 891 | 1 764 |
| Total mark-to-market adjustments | (1 065) | (709) |
The average palladium and rhodium prices decreased by approximately 4% and 9% respectively from the date of provisional recognition to final price realisation, which together with movements in other PGM commodity prices, resulted in the realised mark-to-market adjustments.
| R million | F2023 | F2022 |
| Realised mark-to-market adjustments | (135) | (165) |
|---|---|---|
| Provisional sales value | 4 392 | 4 860 |
| Final sales value | 4 258 | 4 695 |
| Unrealised mark-to-market adjustments | (118) | (65) |
| Initial provisional sales recognition | 815 | 1 181 |
| Period-end provisional sales recognition | 697 | 1 116 |
| Total mark-to-market adjustments | (253) | (231) |
The average palladium and rhodium prices decreased by approximately 4% and 9% respectively from the date of provisional recognition to final price realisation, which together with movements in other PGM commodity prices, resulted in the realised mark-to-market adjustments.
Tonnes milled were 3% higher compared to F2022, as a result of the additional mill capacity commissioned in December 2021, despite the negative impact of power supply disruptions. The grade remains a constraint due to the splitreef (as was reported previously) combined with the blending of the Merensky reef. As a result, PGM production volumes decreased by 2% to 295 441 6E PGM ounces (F2022: 301 935 6E PGM ounces). Following the accelerated development of the declines, mining flexibility is improving and enabling a better mining mix to improve the grade.
Two Rivers Mine unit cash costs increased by 17% to R1 105 per tonne milled (F2022: R941 per tonne). The rand per 6E PGM ounce cash cost increased by 24% to R13 376 per ounce (F2022: R10 773 per ounce), primarily due to above-inflation increases in the costs of consumables such as explosives (up 18%), fuel (up 20%) and electricity (up 19%) compounded by higher diesel consumption to mitigate the impact of load curtailment from Eskom. This was partially offset by increasing the UG2 stockpile while Merensky ore was blended into the mill feed.
Of the R3 167 million spent at Two Rivers Mine, R1 967 million (62%) was attributable to the Merensky project. Deepening of the declines at main and north shafts, along with electrical and mechanical installations, amounted to R454 million (14%) of total capital expenditure. Additionally, R213 million was spent on mining fleet replacement.
Merensky project
Two Rivers' shareholders approved the Two Rivers Merensky project to mine the Merensky reef. Total estimated capital expenditure for the project is R7.2 billion (100% basis). To date, capital expenditure of R3 248 million has been spent.
The majority of the remaining R3 952 million, R2 000 million of which is already committed, will be spent in F2024. The project targets annual production of 182 000 6E PGM ounces, 1 600 tonnes of nickel and 1 300 tonnes of copper.
Both the mining of the Merensky reef and construction works in the mining areas are progressing as planned. The unexpected geotechnical challenges in the concentrator area have been addressed successfully with the plant commissioning date still forecasted for the third quarter of F2024.
The overall project completion date remains unchanged for the second quarter of F2025. The project is scheduled to start producing PGM concentrate as per the planned date of mid-2024. The long-term prospects for the Merensky project remain profitable and accretive to Two Rivers Mine, and are planned to produce PGMs at competitive costs, positioning Two Rivers Mine in the 50th percentile of the global PGM unit cost curve.
| unit | F2023 | F2022 | % change | ||
| Cash operating profit | R million | 3 774 | 5 981 | (37) | |
|---|---|---|---|---|---|
| – PGMs | R million | 3 432 | 5 811 | (41) | |
| – Chrome | R million | 342 | 170 | 101 | |
| Tonnes milled | Mt | 3.58 | 3.46 | 3 | |
| Head grade | g/t, 6E | 3.00 | 3.22 | (7) | |
| PGMs in concentrate | Ounces, 6E | 295 441 | 301 935 | (2) | |
| Chrome in concentrate sold | Tonnes | 190 165 | 214 735 | (11) | |
| Average basket price | ZAR/kg, 6E | 1 136 405 | 1 240 977 | (8) | |
| Average basket price | US$/oz, 6E | 1 990 | 2 533 | (21) | |
| Cash operating margin | % | 46 | 62 | ||
| Cash cost | ZAR/kg, 6E | 430 046 | 346 345 | 24 | |
| Cash cost | R/tonne | 1 105 | 941 | 17 | |
| Cash cost | ZAR/Pt oz | 28 673 | 23 179 | 24 | |
| Cash cost | ZAR/oz, 6E | 13 376 | 10 773 | 24 | |
| Cash cost | US$/oz, 6E | 753 | 708 | 6 |
Tonnes milled improved by 5% as a result of the processing of Merensky ore. The grade, however, decreased by 6%, resulting in a 3% reduction in production volumes to 285 910 6E PGM ounces (F2022: 294 541 6E PGM ounces).
Unit cash costs were up by 21% to R17 728 per 6E PGM ounce (F2022: R14 668 per 6E PGM ounce) and correspondingly higher on a rand-per-tonne basis at R2 021 (F2022: R1 801). The steep rise was largely attributable to spend on engineering, the Merensky setup and above-inflation increases in the costs of consumables (explosives up by 25%, diesel 53% higher, and electricity 16% higher than the prior period).
Capital expenditure at Modikwa Mine (100% basis) rose by 59% to R1 122 million (F2022: R706 million). Of this, R490 million (43%) related to fleet refurbishment and critical spares, R138 million (12%) to capital development and R74 million (7%) to the installation of a proximity detection system for the mining fleet. An additional R72 million related to the Merensky project and R82 million to the replacement of conveyor belts.
The downcast shaft to provide additional ventilation for mining levels below 10 is now estimated to be completed in quarter 3 of F2025 due to the delay of the environmental permit which was approved in March 2023. Site establishment works are forecast for September 2023.
Work has started on the 2.5km underground-to-surface conveyor belt that will enable South 2 shaft to ramp up production by an average of 70 000 tonnes per month to an average of 100 000 tonnes per month by 2026. The project is expected to be completed in June 2024.
The bord-and-pillar Merensky shaft was reopened on a trial basis after a prefeasibility study. The shaft reached and maintained the expected 30 000 tonnes per month level since February 2023. Production is planned to ramp up to 50 000 tonnes per month by December 2023.
| unit | F2023 | F2022 | % change | ||
| Cash operating profit | R million | 2 836 | 4 767 | (41) | |
|---|---|---|---|---|---|
| – PGMs | R million | 2 664 | 4 749 | (44) | |
| – Chrome | R million | 172 | 19 | >200 | |
| Tonnes milled | Mt | 2.51 | 2.40 | 5 | |
| Head grade | g/t 6E | 4.20 | 4.48 | (6) | |
| PGMs in concentrate | 6E oz | 285 910 | 294 541 | (3) | |
| Chrome in concentrate sold | Tonnes | 99 476 | 38 081 | 161 | |
| Average basket price | ZAR/kg 6E | 1 183 603 | 1 319 104 | (10) | |
| Average basket price | US$/oz 6E | 2 072 | 2 698 | (23) | |
| Cash operating margin | % | 36 | 52 | ||
| Cash cost | ZAR/kg 6E | 569 974 | 471 578 | 21 | |
| Cash cost | ZAR/tonne | 2 021 | 1 801 | 12 | |
| Cash cost | ZAR/Pt oz | 43 887 | 37 102 | 18 | |
| Cash cost | ZAR/oz 6E | 17 728 | 14 668 | 21 | |
| Cash cost | US$/oz 6E | 998 | 964 | 3 |
ARM continues to be confident about the long-term profitability of Bokoni. Good progress has been made in advancing the DFS, which has been based on a phased development approach to reduce peak funding requirements, optimise production ramp-up and minimise project execution risk. The DFS also preserves the optionality to increase production to an optimal production rate in the future.
The DFS indicates higher capital costs relative to the 2021 investment case due to inflationary cost increases and an enhanced scope definition. The project remains robust and is expected to be attractive in terms of industry cost competitiveness. The DFS will now advance to bankable feasibility and then be presented to the board for approval.
Of the R692 million spent at Bokoni (100% basis), R378 million related to the early ounce project. A further R88 million related to the purchase of mining fleet and R78 million was spent on the DFS.
Nkomati Mine remains on care and maintenance since 15 March 2021. ARM is evaluating various options regarding the way forward for the mine.
At 30 June 2023, the estimated undiscounted rehabilitation costs attributable to ARM were determined to be R932 million (30 June 2022: R771 million) excluding VAT.
The increase in the undiscounted liability of R161 million is attributed mainly to the provision for the short to medium-term water management costs.
The discounted rehabilitation costs attributable to ARM were determined to be R802 million (30 June 2022: R676 million).
At 30 June 2023, R141 million (attributable to ARM) in cash and financial assets was available to fund rehabilitation obligations for Nkomati Mine. The resulting attributable shortfall in discounted rehabilitation costs of R661 million is expected to be funded by ARM.
Nkomati Mine's estimated rehabilitation costs continue to be reassessed as engineering designs evolve and new information becomes available. Refer to note 26 in the condensed group financial statements.
The European energy crises following the sanctions on Russia have increased demand for coal.
In 1H F2023, this was exacerbated by the switch from gas to coal prompted by record Liquefied Natural Gas (LNG) prices. LNG and coal prices reduced in 2H F2023, resulting in June 2023 coal prices at two-year lows of US$100/tonne. Concerns of oversupply from India and Indonesia also negatively impacted the coal price in 2H F2023.
During the second half of F2023, China shut down various coal mines for safety-improvement measures that positively impacted coal prices. The possible reopening of these mines could negatively impact coal prices going forward.
Approximately 60% of export volumes at Goedgevonden Mine comprised high-quality coal, while PCB's exports of high-quality coal totalled 73%.
| R million | F2023 | F2022 | % change |
| Cash operating profit | 1 220 | 1 525 | (20) |
|---|---|---|---|
| Amortisation and depreciation | (187) | (190) | 2 |
| Imputed interest* | (73) | (120) | 39 |
| Profit on sale of assets | 2 | 4 | 50 |
| Loan re-measurement and fair value losses | (13) | (786) | 98 |
| Profit before taxation | 949 | 434 | 119 |
| Profit on sale of assets | (2) | (4) | (50) |
| Less: Taxation | (407) | (435) | (6) |
| Headline earnings/(loss) attributable to ARM | 540 | (5) | >200 |
* Post-restructuring the ARM Coal loans, all interest expense on partner loans is imputed.
Total sales volumes increased by 3% as the Goedgevonden Mine reduced the impact of TFR underperformance by trucking coal to other ports. ARM attributable saleable production increased by 5% to 1.72 million tonnes from 1.65 million tonnes in F2022.
On-mine unit production costs per saleable tonne increased to R580 per tonne (F2022: R508 per tonne). Cost increases were driven primarily by above-inflationary diesel (up by 57%) and explosives prices (55% higher), offset by increased saleable production.
| unit | F2023 | F2022 | % change | ||
| Total production and sales (100% basis) | |||||
| Saleable production | Mt | 6.63 | 6.33 | 5 | |
| Export thermal coal sales | Mt | 3.93 | 3.93 | – | |
| Domestic thermal coal sales | Mt | 2.65 | 2.47 | 7 | |
| ARM attributable production and sales | |||||
| Saleable production | Mt | 1.72 | 1.65 | 5 | |
| Export thermal coal sales | Mt | 1.02 | 1.02 | – | |
| Domestic thermal coal sales | Mt | 0.69 | 0.64 | 7 | |
| Average received coal price | |||||
| Export (FOB)* | US$/t | 131.49 | 167.72 | (22) | |
| Domestic (FOT)** | ZAR/t | 416 | 371 | 12 | |
| Unit costs | |||||
| On-mine saleable cost | ZAR/t | 580 | 508 | 14 | |
| Capital expenditure | R million | 1 273 | 422 | >200 |
* FOB – free-on-board.
** FOT – free-on-truck.
| R million | F2023 | F2022 | % change |
| Cash operating profit | 2 041 | 2 801 | (27) |
|---|---|---|---|
| Imputed interest | – | (87) | (100) |
| Amortisation and depreciation | (657) | (702) | (6) |
| Loan re-measurement loss | – | (490) | (100) |
| Profit/(loss) on sale of assets | 16 | (9) | – |
| Impairment reversal | – | 748 | (100) |
| Profit before taxation | 1 400 | 2 261 | (38) |
| Add: profit on sale of assets/impairment reversal | (16) | (739) | (98) |
| Less: Taxation | (389) | (589) | (34) |
| Headline earnings attributable to ARM | 995 | 933 | 7 |
Export sales volumes at PCB were 7% lower at 9.1 million tonnes (F2022: 9.8 million tonnes). Domestic sales volumes declined by 6% to 0.98 million tonnes (F2022: 1.04 million tonnes) due to the expiry of certain domestic contracts.
Production at the PCB operations was negatively impacted by operational challenges at TFR, resulting in high product stockpiles. ARM attributable saleable production was 2.02 million tonnes in F2023 compared to 2.06 million tonnes in F2022.
Unit production costs per saleable tonne increased to R815 per tonne (F2022: R633 per tonne). The 29% increase in unit costs is due to the lower saleable production, together with above-inflationary diesel (up 57%) and explosives (55% higher) price increases.
| unit | F2023 | F2022 | % change | ||
| Total production sales (100% basis) | |||||
| Saleable production | Mt | 10.01 | 10.18 | (2) | |
| Export thermal coal sales | Mt | 9.12 | 9.79 | (7) | |
| Domestic thermal coal sales | Mt | 0.98 | 1.04 | (6) | |
| ARM attributable production and sales | |||||
| Saleable production | Mt | 2.02 | 2.06 | (2) | |
| Export thermal coal sales | Mt | 1.84 | 1.98 | (7) | |
| Domestic thermal coal sales | Mt | 0.20 | 0.21 | (6) | |
| Average received coal price | |||||
| Export (FOB)* | US$/t | 133.34 | 160.54 | (17) | |
| Domestic (FOT)** | ZAR/t | 810 | 558 | 45 | |
| Unit costs | |||||
| On-mine saleable cost | ZAR/t | 815 | 633 | 29 | |
| Capital expenditure | R million | 1 761 | 1 126 | 56 |
* FOB – free-on-board.
** FOT – free-on-truck.
ARM's economic interest in PCB is 20.2%. PCB consists of two large mining complexes in Mpumalanga.
ARM has a 26% effective interest in the Goedgevonden Mine near Ogies in Mpumalanga.
ARM's investment in Harmony was positively revalued by R2 037 million in F2023 (F2022: R59 million loss) as the Harmony share price increased by 52% from R51.97 per share at 30 June 2022 to R79.25 per share at 30 June 2023. The Harmony investment is therefore reflected on the ARM statement of financial position at R5 918 million (F2022: R3 881 million) based on its share price.
Gains and losses are accounted for, net of deferred capital gains tax, through the statement of comprehensive income. Dividends from Harmony are recognised in the ARM statement of profit or loss on the last day of registration following dividend declaration.
Harmony's results for the year ended 30 June 2023 can be found on its website: www.harmony.co.za.
Volatility in global commodity markets continues to be driven by multiple sources of uncertainty, including a potential slowdown in growth in both China and the rest of the world, continued high inflation, tightening monetary policy across major economies, lingering economic repercussions from COVID-19 as well the conflict in Ukraine. Global commodity markets have further been impacted by a series of supply shocks, which have mostly been driven by weather-related events.
Sentiment relating to China's growth expectations continues to disappoint as economic data surprises on the downside. The recovery in China's metal demand has fallen behind market expectations and is expected to remain sluggish in the second half of 2023, putting pressure on metal prices.
In the medium to long term, slowing infrastructure spend and crude steel production in China are expected to put pressure on demand for iron ore, however, iron ore producer cost pressure is expected to provide some support to prices. Additional supply from new projects in Africa could bring in low-cost production, further increasing the downward risk to prices.
Platinum group metal prices have come under immense pressure with the US dollar basket prices reducing by more than 30% since the beginning of the 2023 calendar year. In the medium term, we are cognisant of the threat from increased battery vehicle production. However, recovery in autocatalyst demand and tightening emission standards are expected to be positive for PGM demand, while the role of platinum in clean mobility (through hydrogen technology) is expected to provide price support in the longer term.
Infrastructure-related challenges in South Africa, including rail and port performance, reliable supply of power and water security, remain a significant risk for the ARM operations and are expected to continue putting pressure on volumes and in turn unit costs. We are working with government and other stakeholders to find sustainable solutions that benefit the mining industry and the country. Though Transnet's and Eskom's operational challenges remain significant, there have been some positive shifts recently that point to a constructive longer-term reform trajectory. These include the establishment of the government-business logistics recovery steering committee, and corporates pledging to support government, which bodes well for structural reform and investment. We are encouraged by these developments, though such momentum will need to be maintained and deepened in the coming months.
We remain focused on positioning our operations to deliver into this increased demand by: producing high-quality commodities that benefit from the green energy transition; exploring value-enhancing growth opportunities; containing unit cost escalations; applying innovative technologies; and delivering approved capital projects on time and on budget.
ARM aims to pay ordinary dividends to shareholders in line with our dividend guiding principles. Dividends are at the discretion of the board of directors, which considers the company's capital allocation guiding principles and other relevant factors such as financial performance, commodities outlook, investment opportunities, gearing levels as well as solvency and liquidity requirements of the Companies Act.
For F2023, the board approved and declared a final dividend of 1 200 cents per share (gross) (F2022: 2 000 cents per share). The amount to be paid is approximately R2 696 million.
The dividend declared will be subject to dividend withholding tax. In line with paragraphs 11.17(a) (i) to (x) and 11.17(c) of the JSE Listings Requirements, the following additional information is disclosed:
A gross dividend of 1 200 cents per ordinary share, being the dividend for the year ended 30 June 2023, has been declared payable on Monday, 9 October 2023 to those shareholders recorded in the books of the company at the close of business on Friday, 6 October 2023. The dividend is declared in the currency of South Africa. Any change in address or dividend instruction applying to this dividend must be received by the company's transfer secretaries or registrar no later than Friday, 6 October 2023. The last day to trade ordinary shares cum dividend is Tuesday, 3 October 2023. Ordinary shares trade ex-dividend from Wednesday, 4 October 2023. The record date is Friday, 6 October 2023 while the payment date is Monday, 9 October 2023.
No dematerialisation or rematerialisation of share certificates may occur between Wednesday, 4 October 2023 and Friday, 6 October 2023 both dates inclusive, nor may any transfers between registers take place during this period.
There has been no material change to ARM's Mineral Resources and Mineral Reserves as disclosed in the integrated annual report for the financial year ended 30 June 2022, other than the depletion due to continued mining activities at the operations and the acquisition of Bokoni Mine. ARM's acquisition of Bokoni Mine, which became effective on 1 September 2022, resulted in the following additional Mineral Resources:
| Category | Tonnes (Mt) |
Pt (g/t) |
Pd (g/t) |
Rh (g/t) |
Au (g/t) |
4E (g/t) |
4E (Moz) |
| Measured | 112.6 | 2.99 | 3.54 | 0.58 | 0.13 | 7.25 | 26.2 |
|---|---|---|---|---|---|---|---|
| Indicated | 173.0 | 2.92 | 3.44 | 0.58 | 0.12 | 7.06 | 39.3 |
| Measured and indicated | 285.6 | 2.95 | 3.48 | 0.58 | 0.13 | 7.13 | 65.5 |
| Inferred | 54.3 | 2.99 | 3.49 | 0.58 | 0.13 | 7.19 | 12.6 |
| Total | 340.0 | 2.95 | 3.48 | 0.58 | 0.13 | 7.14 | 78.0 |
Notes:
| Category | Tonnes (Mt) |
Pt (g/t) |
Pd (g/t) |
Rh (g/t) |
Au (g/t) |
4E (g/t) |
4E (Moz) |
| Measured | 27.7 | 3.19 | 1.50 | 0.18 | 0.33 | 5.19 | 4.6 |
|---|---|---|---|---|---|---|---|
| Indicated | 78.8 | 3.21 | 1.49 | 0.18 | 0.32 | 5.20 | 13.2 |
| Measured and indicated | 106.5 | 3.20 | 1.49 | 0.18 | 0.32 | 5.20 | 17.8 |
| Inferred | 68.1 | 3.14 | 1.46 | 0.17 | 0.32 | 5.10 | 11.2 |
| Total | 174.6 | 3.18 | 1.48 | 0.18 | 0.32 | 5.16 | 29.0 |
Notes:
An updated Mineral Resources and Mineral Reserves statement will be issued in our F2023 integrated annual report.
As previously announced on the JSE Stock Exchange News Service (SENS), the following changes to the board took place:
Signed on behalf of the board:
PT Motsepe
Executive Chairman
VP Tobias
Chief Executive Officer
We have reviewed the condensed group financial statements ('financial statements') of African Rainbow Minerals Limited ('ARM' or 'Group') set out in our Financial Performance and Notes, contained in the accompanying condensed financial statements "African Rainbow Minerals Condensed reviewed results for the financial year ended 30 June 2023 and cash divdend declaration", which comprise the condensed group statement of financial position as at 30 June 2023, and the condensed group statement of profit or loss, condensed group statement of comprehensive income, condensed group statement of changes in equity, and condensed group statement of cash flows for the year then ended, and selected explanatory notes.
The directors are responsible for the preparation and presentation of these condensed group financial statements in accordance with the requirements of the JSE Limited Listings Requirements for condensed financial statements, as set out in note 1 to the financial statements, and the requirements of the Companies Act of South Africa, and for such internal control as the directors determine is necessary to enable the preparation of financial statements that are free from material misstatement, whether due to fraud or error.
Our responsibility is to express a conclusion on these financial statements. We conducted our review in accordance with International Standard on Review Engagements (ISRE) 2410, which applies to a review of historical information performed by the independent auditor of the entity. ISRE 2410 requires us to conclude whether anything has come to our attention that causes us to believe that the financial statements are not prepared in all material respects in accordance with the applicable financial reporting framework. This standard also requires us to comply with relevant ethical requirements.
A review of financial statements in accordance with ISRE 2410 is a limited assurance engagement. We perform procedures, primarily consisting of making inquiries of management and others within the entity, as appropriate, and applying analytical procedures, and evaluate the evidence obtained.
The procedures performed in a review are substantially less than those performed in an audit conducted in accordance with International Standards on Auditing. Accordingly, we do not express an audit opinion on these financial statements.
Based on our review, nothing has come to our attention that causes us to believe that the condensed group financial statements of African Rainbow Minerals Limited for the year ended 30 June 2023 are not prepared, in all material respects, in accordance with the requirements of the JSE Limited Listings Requirements for condensed financial statements, as set out in note 1 to the condensed group financial statements, and the requirements of the Companies Act of South Africa.
Ernst & Young Inc.
Director – Philippus Dawid Grobbelaar
Registered Auditor
Chartered Accountant (SA)
4 September 2023
102 Rivonia Road
Sandton
2146